

Cytochrome c biosensor--a model for gas sensing
- PMID: 22163937
- PMCID: PMC3231445
- DOI: 10.3390/s110605968
Cytochrome c biosensor--a model for gas sensing
Abstract
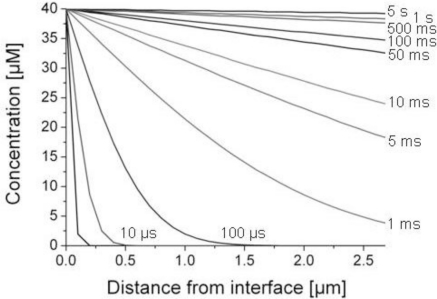
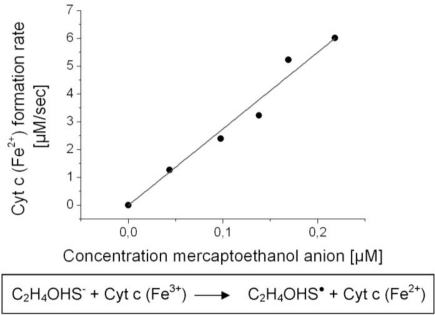
This work is about gas biosensing with a cytochrome c biosensor. Emphasis is put on the analysis of the sensing process and a mathematical model to make predictions about the biosensor response. Reliable predictions about biosensor responses can provide valuable information and facilitate biosensor development, particularly at an early development stage. The sensing process comprises several individual steps, such as phase partition equilibrium, intermediate reactions, mass-transport, and reaction kinetics, which take place in and between the gas and liquid phases. A quantitative description of each step was worked out and finally combined into a mathematical model. The applicability of the model was demonstrated for a particular example of methanethiol gas detection by a cytochrome c biosensor. The model allowed us to predict the optical readout response of the biosensor from tabulated data and data obtained in simple liquid phase experiments. The prediction was experimentally verified with a planar three-electrode electro-optical cytochrome c biosensor in contact with methanethiol gas in a gas tight spectroelectrochemical measurement cell.
Keywords: biosensor; cytochrome c; model; prediction; sensing process; thiol.
Figures


Similar articles
-
Electrochemical determination of hydrogen peroxide with cytochrome c peroxidase and horse heart cytochrome c entrapped in a gelatin hydrogel.Bioelectrochemistry. 2012 Feb;83:15-8. doi: 10.1016/j.bioelechem.2011.07.001. Epub 2011 Aug 1. Bioelectrochemistry. 2012. PMID: 21889423
-
Direct electrochemical behavior of cytochrome c on DNA-modified glassy carbon electrode and its application to cytochrome c biosensor.Anal Sci. 2006 Aug;22(8):1071-4. doi: 10.2116/analsci.22.1071. Anal Sci. 2006. PMID: 16896244
-
The influence of external factors on the operational stability of the biosensor response.Talanta. 2010 Jun 15;81(4-5):1245-9. doi: 10.1016/j.talanta.2010.02.016. Epub 2010 Feb 13. Talanta. 2010. PMID: 20441891
-
New glucose biosensor based on glucose oxidase-immobilized gelatin film coated electrodes.J Biomater Appl. 2004 Apr;18(4):265-77. doi: 10.1177/0885328204040950. J Biomater Appl. 2004. PMID: 15070514
-
Edge plane pyrolytic graphite electrodes in electroanalysis: an overview.Anal Sci. 2005 Nov;21(11):1263-8. doi: 10.2116/analsci.21.1263. Anal Sci. 2005. PMID: 16317891 Review.
Cited by
-
Protein adsorption onto nanomaterials for the development of biosensors and analytical devices: a review.Anal Chim Acta. 2015 May 4;872:7-25. doi: 10.1016/j.aca.2014.10.031. Epub 2014 Oct 29. Anal Chim Acta. 2015. PMID: 25892065 Free PMC article. Review.
-
Finite Element Modelling of Bandgap Engineered Graphene FET with the Application in Sensing Methanethiol Biomarker.Sensors (Basel). 2021 Jan 15;21(2):580. doi: 10.3390/s21020580. Sensors (Basel). 2021. PMID: 33467459 Free PMC article.
-
A survey on gas sensing technology.Sensors (Basel). 2012;12(7):9635-65. doi: 10.3390/s120709635. Epub 2012 Jul 16. Sensors (Basel). 2012. PMID: 23012563 Free PMC article.
-
High-Tech and Nature-Made Nanocomposites and Their Applications in the Field of Sensors and Biosensors for Gas Detection.Biosensors (Basel). 2020 Nov 13;10(11):176. doi: 10.3390/bios10110176. Biosensors (Basel). 2020. PMID: 33203038 Free PMC article. Review.
-
Bioinspired sensor systems.Sensors (Basel). 2011;11(11):10180-6. doi: 10.3390/s111110180. Epub 2011 Oct 26. Sensors (Basel). 2011. PMID: 22346637 Free PMC article.
References
-
- Rosenberg M. Clinical assessment of bad breath: Current concepts. J. Am. Dent. Assoc. 1996;127:475–482. - PubMed
-
- Tonzetich J. Direct gas chromatographic analysis of sulphur compounds in mouth air in man. Arch. Oral Biol. 1971;16:587–597. - PubMed
-
- Kharitonov SA, Barnes PJ. Biomarkers of some pulmonary diseases in exhaled breath. Biomarkers. 2002;7:1–32. - PubMed
-
- Rock F, Barsan N, Weimar U. Electronic nose: Current status and future trends. Chem. Rev. 2008;108:705–725. - PubMed
-
- Mitsubayashi K, Hashimoto Y. Bioelectronic nose for methyl mercaptan vapor using xenobiotic metabolizing enzyme: Flavin-containing monooxygenase. Sens. Actuat. B. 2002;83:35–40.
MeSH terms
Substances
LinkOut - more resources
Full Text Sources
