Remote real-time monitoring of subsurface landfill gas migration
- PMID: 22163975
- PMCID: PMC3231696
- DOI: 10.3390/s110706603
Remote real-time monitoring of subsurface landfill gas migration
Abstract
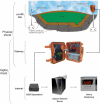
The cost of monitoring greenhouse gas emissions from landfill sites is of major concern for regulatory authorities. The current monitoring procedure is recognised as labour intensive, requiring agency inspectors to physically travel to perimeter borehole wells in rough terrain and manually measure gas concentration levels with expensive hand-held instrumentation. In this article we present a cost-effective and efficient system for remotely monitoring landfill subsurface migration of methane and carbon dioxide concentration levels. Based purely on an autonomous sensing architecture, the proposed sensing platform was capable of performing complex analytical measurements in situ and successfully communicating the data remotely to a cloud database. A web tool was developed to present the sensed data to relevant stakeholders. We report our experiences in deploying such an approach in the field over a period of approximately 16 months.
Keywords: carbon dioxide; chemistry; environmental monitoring; greenhouse gases; landfill; methane; sensor data management; sensor networks.
Figures


Similar articles
-
Mitigation of methane emissions in a pilot-scale biocover system at the AV Miljø Landfill, Denmark: 2. Methane oxidation.Waste Manag. 2017 May;63:203-212. doi: 10.1016/j.wasman.2017.01.012. Epub 2017 Feb 1. Waste Manag. 2017. PMID: 28161333
-
Biotic systems to mitigate landfill methane emissions.Waste Manag Res. 2008 Feb;26(1):33-46. doi: 10.1177/0734242X07087977. Waste Manag Res. 2008. PMID: 18338700 Review.
-
Measured gas emissions from four landfills in south africa and some implications for landfill design and methane recovery in semi-arid climates.Waste Manag Res. 2004 Dec;22(6):440-53. doi: 10.1177/0734242X04048332. Waste Manag Res. 2004. PMID: 15666447
-
Generating CO(2)-credits through landfill in situ aeration.Waste Manag. 2010 Apr;30(4):702-6. doi: 10.1016/j.wasman.2009.11.014. Waste Manag. 2010. PMID: 20022235
-
Mitigation of global greenhouse gas emissions from waste: conclusions and strategies from the Intergovernmental Panel on Climate Change (IPCC) Fourth Assessment Report. Working Group III (Mitigation).Waste Manag Res. 2008 Feb;26(1):11-32. doi: 10.1177/0734242X07088433. Waste Manag Res. 2008. PMID: 18338699 Review.
Cited by
-
Green IoT Event Detection for Carbon-Emission Monitoring in Sensor Networks.Sensors (Basel). 2023 Dec 27;24(1):162. doi: 10.3390/s24010162. Sensors (Basel). 2023. PMID: 38203023 Free PMC article.
-
Advanced IoT Pressure Monitoring System for Real-Time Landfill Gas Management.Sensors (Basel). 2023 Aug 31;23(17):7574. doi: 10.3390/s23177574. Sensors (Basel). 2023. PMID: 37688023 Free PMC article.
-
A Robust Miniaturized Gas Sensor for H2 and CO2 Detection Based on the 3ω Method.Sensors (Basel). 2022 Jan 9;22(2):485. doi: 10.3390/s22020485. Sensors (Basel). 2022. PMID: 35062446 Free PMC article.
References
-
- Solomon S, Qin D, Manning M, Chen Z, Marquis M, Averyt KB, Tignor M, Miller HL. Climate Change 2007: The Physical Science Basis Contribution of Working Group I to the Fourth Assessment Report of the Intergovernmental Panel on Climate Change. Cambridge University Press; Cambridge, UK; New York, NY, USA: 2007.
-
- Austin B. The Involvement of Pollution with Fish Health. In: Mothersill C, Mosse I, Seymour C, editors. Multiple Stressors: A Challenge for the Future. Springer; Dordrecht, The Netherlands: 2007. pp. 13–30.
-
- Yasuda M, Hanagiri T, Shigematsu Y, Onitsuka T, Kuroda K, Baba T, Mizukami M, Ichiki Y, Uramoto H, Takenoyama M, Yasumoto K. Identification of a Tumour Associated Antigen in Lung Cancer Patients with Asbestos Exposure. Anticanc. Res. 2010;30:2631–2639. - PubMed
-
- Kazakov VS, Demidchik EP, Astakhova LN. Thyroid cancer after Chernobyl. Nature. 1992;359:21–22. - PubMed
-
- Khurana VG, Hardell L, Everaert J, Bortkiewicz A, Carlberg M, Ahonen M. Epidemiological evidence for a health risk from mobile phone base stations. Int. J. Occup. Environ. Health. 2010;16:263–267. - PubMed
Publication types
MeSH terms
Substances
LinkOut - more resources
Full Text Sources
Other Literature Sources

