

Visual odometry based on structural matching of local invariant features using stereo camera sensor
- PMID: 22164016
- PMCID: PMC3231658
- DOI: 10.3390/s110707262
Visual odometry based on structural matching of local invariant features using stereo camera sensor
Abstract
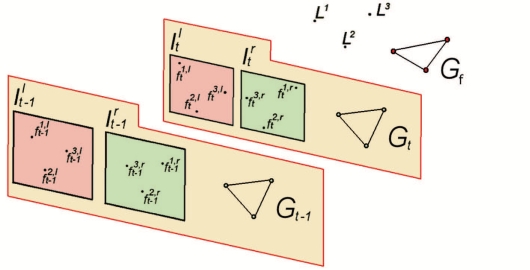
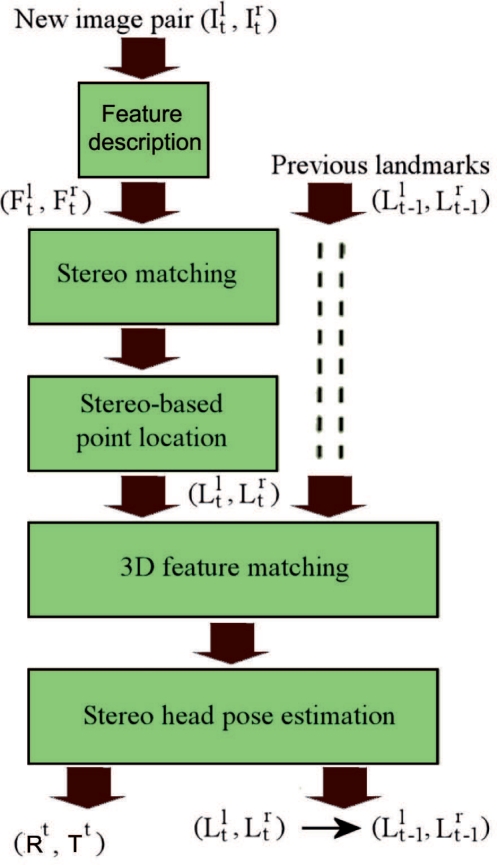
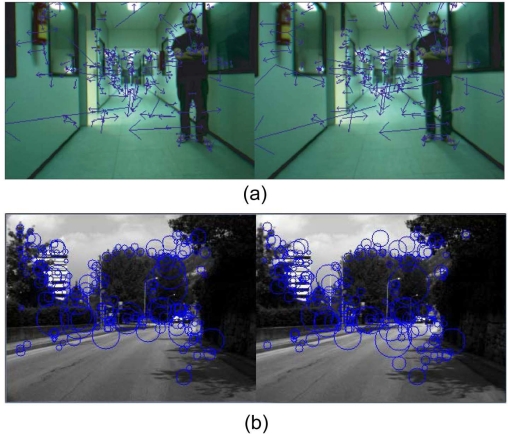
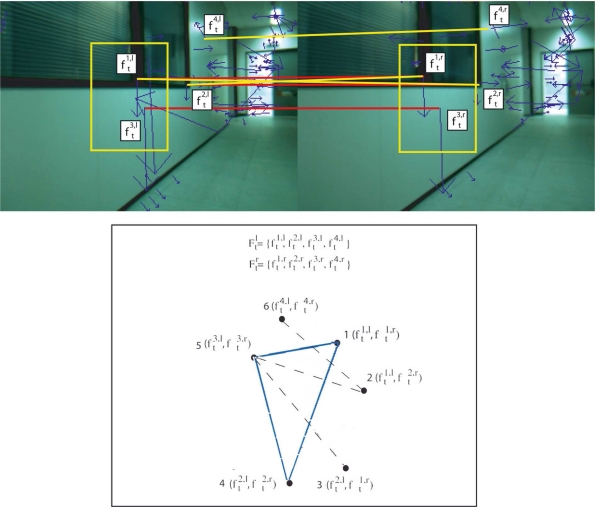
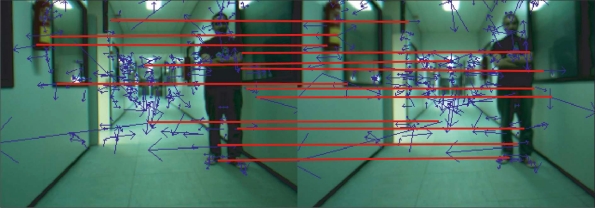
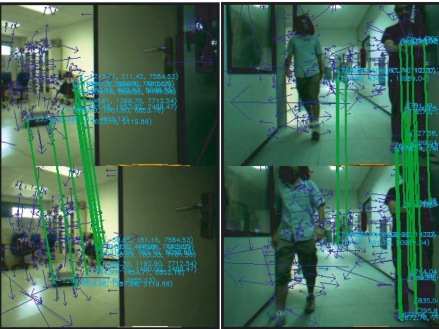
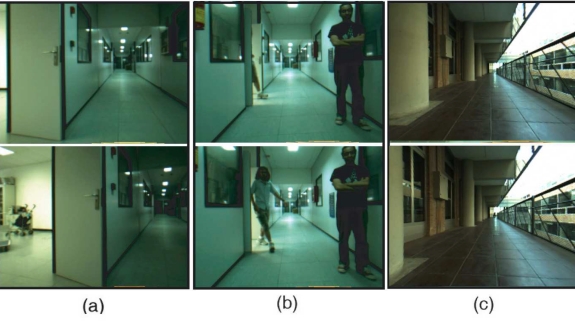
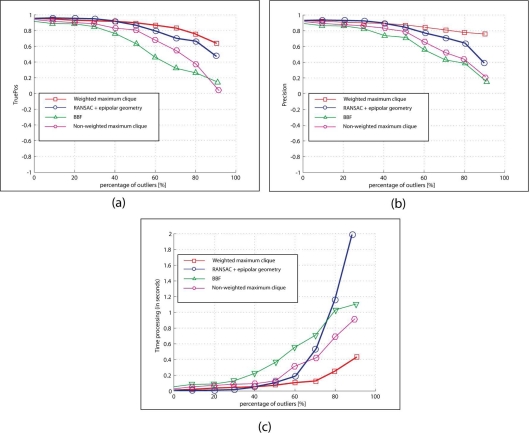
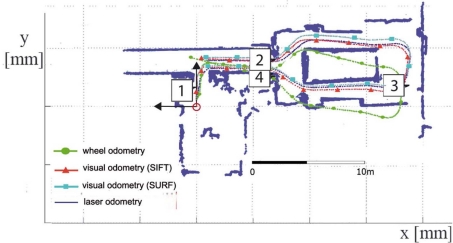
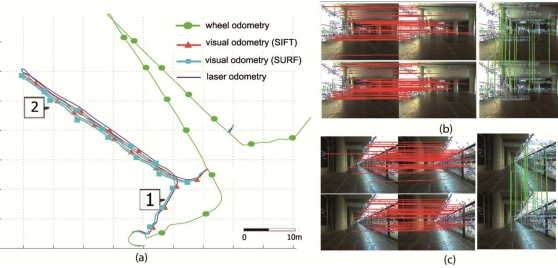
This paper describes a novel sensor system to estimate the motion of a stereo camera. Local invariant image features are matched between pairs of frames and linked into image trajectories at video rate, providing the so-called visual odometry, i.e., motion estimates from visual input alone. Our proposal conducts two matching sessions: the first one between sets of features associated to the images of the stereo pairs and the second one between sets of features associated to consecutive frames. With respect to previously proposed approaches, the main novelty of this proposal is that both matching algorithms are conducted by means of a fast matching algorithm which combines absolute and relative feature constraints. Finding the largest-valued set of mutually consistent matches is equivalent to finding the maximum-weighted clique on a graph. The stereo matching allows to represent the scene view as a graph which emerge from the features of the accepted clique. On the other hand, the frame-to-frame matching defines a graph whose vertices are features in 3D space. The efficiency of the approach is increased by minimizing the geometric and algebraic errors to estimate the final displacement of the stereo camera between consecutive acquired frames. The proposed approach has been tested for mobile robotics navigation purposes in real environments and using different features. Experimental results demonstrate the performance of the proposal, which could be applied in both industrial and service robot fields.
Keywords: combined constraint matching algorithm; maximum-weighted clique; robotic; stereo vision sensor; visual odometry sensor.
Figures
Similar articles
-
Photometric Calibration for Stereo Camera with Gamma-like Response Function in Direct Visual Odometry.Sensors (Basel). 2021 Oct 24;21(21):7048. doi: 10.3390/s21217048. Sensors (Basel). 2021. PMID: 34770355 Free PMC article.
-
A Robust Method for Ego-Motion Estimation in Urban Environment Using Stereo Camera.Sensors (Basel). 2016 Oct 17;16(10):1704. doi: 10.3390/s16101704. Sensors (Basel). 2016. PMID: 27763508 Free PMC article.
-
A Miniature Binocular Endoscope with Local Feature Matching and Stereo Matching for 3D Measurement and 3D Reconstruction.Sensors (Basel). 2018 Jul 12;18(7):2243. doi: 10.3390/s18072243. Sensors (Basel). 2018. PMID: 30002288 Free PMC article.
-
Neuromorphic Stereo Vision: A Survey of Bio-Inspired Sensors and Algorithms.Front Neurorobot. 2019 May 28;13:28. doi: 10.3389/fnbot.2019.00028. eCollection 2019. Front Neurorobot. 2019. PMID: 31191287 Free PMC article. Review.
-
Sensor-level computer vision with pixel processor arrays for agile robots.Sci Robot. 2022 Jun 29;7(67):eabl7755. doi: 10.1126/scirobotics.abl7755. Epub 2022 Jun 29. Sci Robot. 2022. PMID: 35767647 Review.
Cited by
-
Definition of linear color models in the RGB vector color space to detect red peaches in orchard images taken under natural illumination.Sensors (Basel). 2012;12(6):7701-18. doi: 10.3390/s120607701. Epub 2012 Jun 7. Sensors (Basel). 2012. PMID: 22969369 Free PMC article.
-
An exact algorithm to find a maximum weight clique in a weighted undirected graph.Sci Rep. 2024 Apr 20;14(1):9118. doi: 10.1038/s41598-024-59689-x. Sci Rep. 2024. PMID: 38643335 Free PMC article.
-
Real-Time Vehicle Positioning and Mapping Using Graph Optimization.Sensors (Basel). 2021 Apr 16;21(8):2815. doi: 10.3390/s21082815. Sensors (Basel). 2021. PMID: 33923735 Free PMC article.
References
-
- Zaman M. High resolution relative localisation using two cameras. Rob. Autonomous Syst. 2007;55:685–692.
-
- Nister D, Naroditsky O, Bergen J. Visual Odometry. Proceedings of the 2004 IEEE Computer Society Conference on Computer Vision and Pattern Recognition (CVPR’04); Washington, DC, USA. 27 June–2 July 2004; pp. 652–659. Volume 1.
-
- Konolige K, Agrawal M. Frame-Frame Matching for Realtime Consistent Visual Mapping. Proceedings of the IEEE International Conference on Robotics and Automation, ICRA 2007; Roma, Italy. 10–14 April 2007; pp. 2803–2810.
-
- Klein G, Murray D. Improving the agility of keyframe-based SLAM. Lect. Note Computer. Sci. 2008;5303:802–815.
-
- Cheng Y, Maimone MW, Matthies L. Visual odometry on the Mars exploration rovers—a tool to ensure accurate driving and science imaging. IEEE Rob. Autom. Mag. 2006;13:54–62.
Publication types
MeSH terms
LinkOut - more resources
Full Text Sources
Other Literature Sources
