. 2011 Nov 30:2:355.
doi: 10.3389/fpsyg.2011.00355. eCollection 2011.

The dynamics of reference and shared visual attention

Affiliations

The dynamics of reference and shared visual attention

Rick Dale et al. Front Psychol. .

Abstract

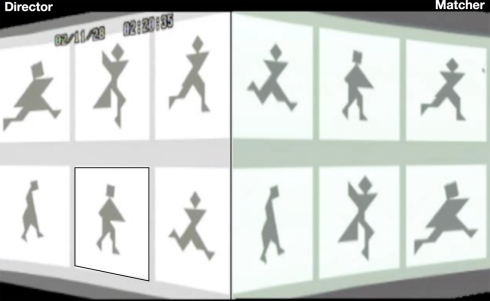
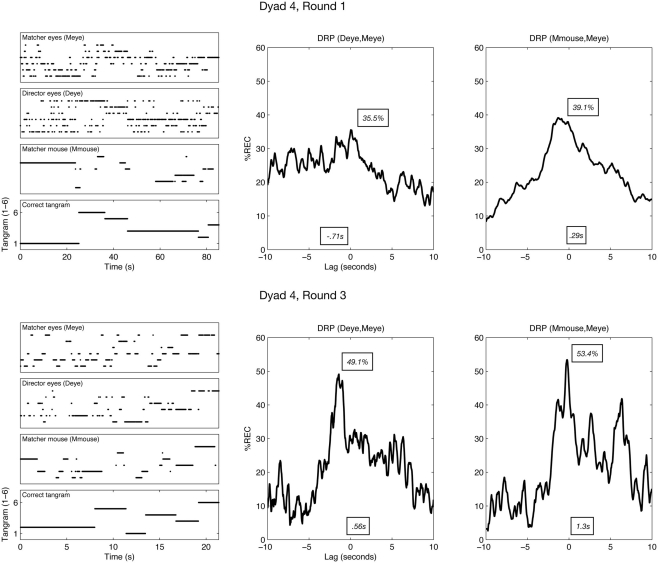
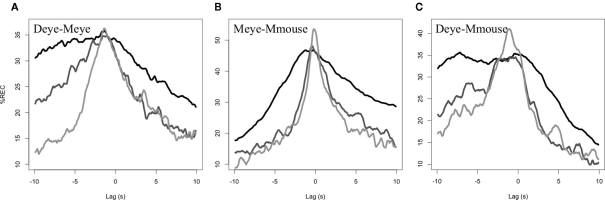
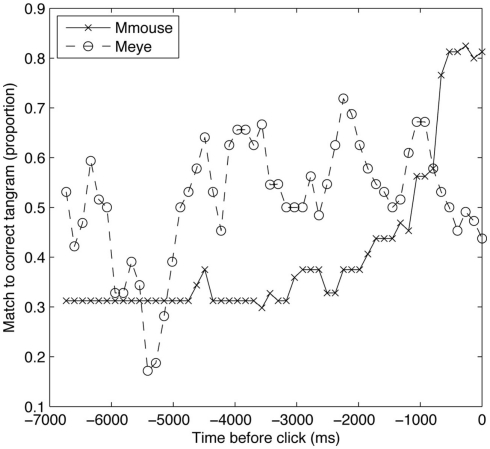
In the tangram task, two participants are presented with the same set of abstract shapes portrayed in different orders. One participant must instruct the other to arrange their shapes so that the orders match. To do this, they must find a way to refer to the abstract shapes. In the current experiment, the eye movements of pairs of participants were tracked while they were engaged in a computerized version of the task. Results revealed the canonical tangram effect: participants became faster at completing the task from round 1 to round 3. Also, their eye-movements synchronized over time. Cross-recurrence analysis was used to quantify this coordination, and showed that as participants' words coalesced, their actions approximated a single coordinated system.

Keywords: attention; communication; coordination; interaction; language; reference; synchrony; vision.


Figures

Figure 1
Figure 1
Split screen view of an example tangram trial used in this task. The director, looking at the screen on the left, seeks a description to help the matcher select the same shape on his or her screen. Across rounds, referential language changes from detailed descriptions, such as “the guy kind of carrying the triangle,” (highlighted here with a box) to simplified, entrained expressions, such as “carrying guy.”
Figure 2
Figure 2
Left column: example time series from one dyad in rounds 1 and 3. The bottom row shows, across time, the correct tangram (expressed as numeric code) that the director is attempting to get the matcher to find. Above this correct tangram is the time series for each of the analyzed channels. For example, Deye (director eyes) shows the time series of which tangram is fixated at a given moment (expressed again as a consistent code from 1 to 6). Middle/right columns: the recurrence lag profiles of pairs of these time series, with mean (s) and maximum (%) shown as examples of quantifying the profiles as a distribution (DRP = diagonal-wise recurrence profile). The profile is constructed by finding how much each time series matches (expressed as percentage recurrence, %REC) when they are lagged relative to one another. The maximum would reflect, for example, the relative point in time at which the channels are maximally aligned. See main text for more details.
Figure 3
Figure 3
Mean lag profiles across dyads. Round (A) is black, round (B) mid grey, and round (C) light grey.
Figure 4
Figure 4
Eye and mouse fixations on the correct tangram shape in the seconds before selection.
Figure A1
Figure A1
Simple shuffling tends to produce a higher proportion of simulated baselines than the virtual pair method, especially as the ‘true’ coupling between systems strengthens.

References

    1. Baayen R. H., Davidson D. J., Bates D. M. (2008). Mixed-effects modeling with crossed random effects for subjects and items. J. Mem. Lang. 59, 390–41210.1016/j.jml.2007.12.005 - DOI
    1. Bakeman R., Robinson B. F., Quera V. (1996). Testing sequential association: estimating exact p values using sampled permutations. Psychol. Methods 1, 4–1510.1037/1082-989X.1.1.4 - DOI
    1. Ballard D. H., Hayhoe M. M., Pelz J. B. (1995). Memory representations in natural tasks. J. Cogn. Neurosci. 7, 66–8010.1162/jocn.1995.7.1.66 - DOI - PubMed
    1. Barsalou L. W. (1999). Perceptual symbol systems. Behavi. Brain Sci. 22, 577–660 - PubMed
    1. Boker S. M., Xu M., Rotondo J. L., King K. (2002). Windowed cross-correlation and peak picking for the analysis of variability in the association between behavioral time series. Psychol. Methods 7, 338–35510.1037/1082-989X.7.3.338 - DOI - PubMed

LinkOut - more resources