. 2011;6(12):e27474.
doi: 10.1371/journal.pone.0027474. Epub 2011 Dec 2.

Modulation of calcium-dependent inactivation of L-type Ca2+ channels via β-adrenergic signaling in thalamocortical relay neurons

Affiliations

Modulation of calcium-dependent inactivation of L-type Ca2+ channels via β-adrenergic signaling in thalamocortical relay neurons

Vladan Rankovic et al. PLoS One. 2011.

Abstract

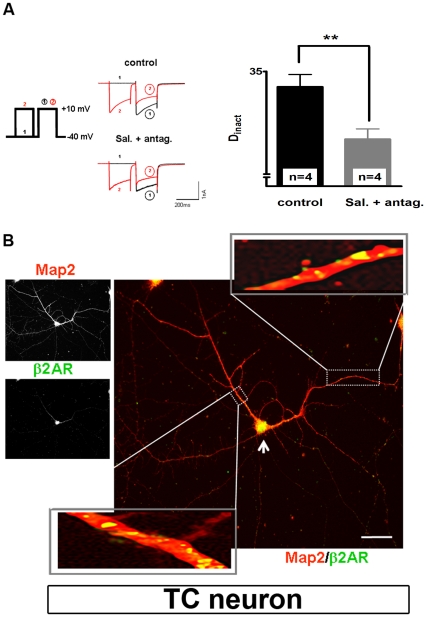
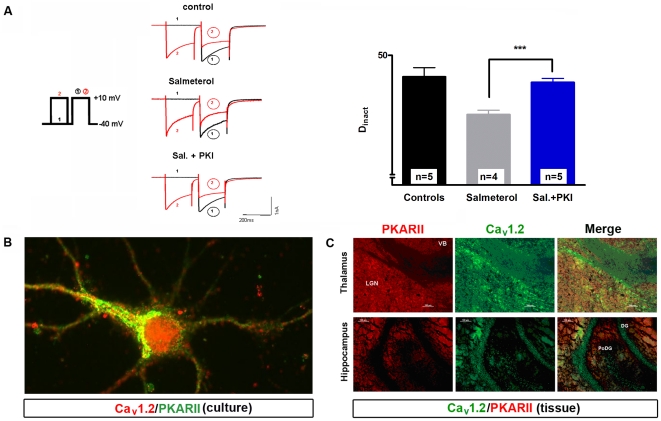
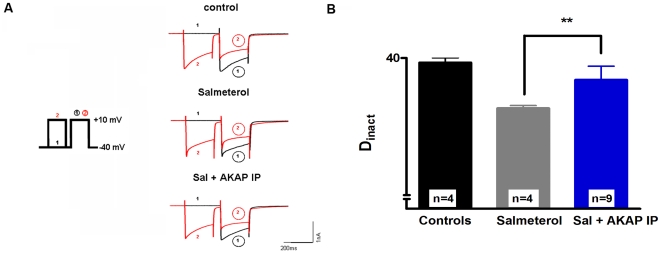
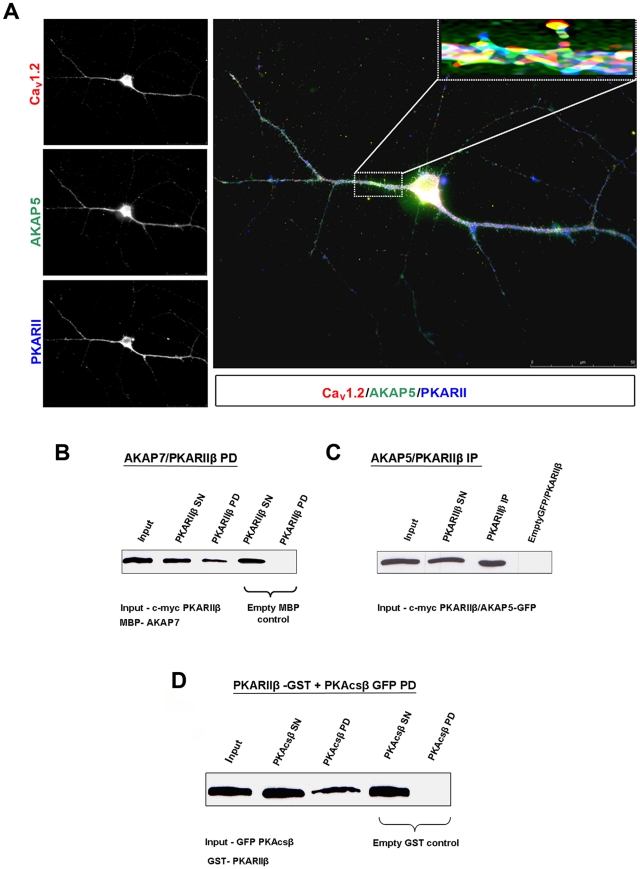
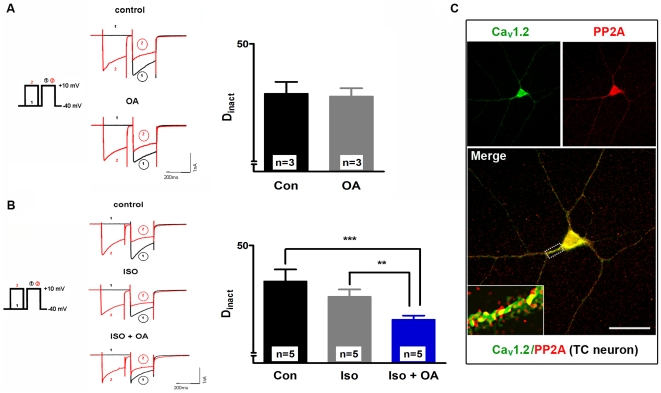
Neuronal high-voltage-activated (HVA) Ca(2+) channels are rapidly inactivated by a mechanism that is termed Ca(2+)-dependent inactivation (CDI). In this study we have shown that β-adrenergic receptor (βAR) stimulation inhibits CDI in rat thalamocortical (TC) relay neurons. This effect can be blocked by inhibition of cAMP-dependent protein kinase (PKA) with a cell-permeable inhibitor (myristoylated protein kinase inhibitor-(14-22)-amide) or A-kinase anchor protein (AKAP) St-Ht31 inhibitory peptide, suggesting a critical role of these molecules downstream of the receptor. Moreover, inhibition of protein phosphatases (PP) with okadaic acid revealed the involvement of phosphorylation events in modulation of CDI after βAR stimulation. Double fluorescence immunocytochemistry and pull down experiments further support the idea that modulation of CDI in TC neurons via βAR stimulation requires a protein complex consisting of Ca(V)1.2, PKA and proteins from the AKAP family. All together our data suggest that AKAPs mediate targeting of PKA to L-type Ca(2+) channels allowing their phosphorylation and thereby modulation of CDI.


Conflict of interest statement

Competing Interests: The authors have declared that no competing interests exist.

Figures

Figure 1
Figure 1. Tissue-specific expression patterns of mRNAs of the main components of βAR signaling in the dLGN of Long Evans rats.
RT-PCRs of mRNA from whole brain extracts (A) and VB (B) show that the α1C subunit (colored squares) as well as other Ca2+ channels forms are widely expressed. The skeletal muscle form α1S was not found in both regions (as well as in dLGN, see Figure F). In all experiments, appropriate markers for size were used in order to assure detection of specific forms of Ca2+ channels. (C) Using specific primers for all three types of βAR, we have shown specific expression of only β1 and β2AR. β3AR was neither expressed in VB nor in dLGN. (D) Following the same procedure, we have shown the expression of some of the G proteins coupled with metabotropic receptors (Gα and Gi) in dLGN. In all experiments specific markers for size were used. (E) Expression of three different adenylate cyclases, namely type 1, 6 and 8 with two isoforms A/B and C in dLGN.
Figure 2
Figure 2. Single cell and qRT-PCR expression profiles of AKAP5, AKAP7 and the Gs subunit of G proteins.
(A) Two different cell types are expressed in LGN, interneurons that are GAD67 positive and TC neurons that are GAD67 negative. These types of cells were collected under visual control and classified based on their morphological differences. Thereafter, mRNA was extracted. Representative PCR gel photo showing bands specific for AKAP5, AKAP7, and the Gs subunit of G proteins. Note that AKAP5 is only expressed in TC neurons while AKAP7 was not detectable. (B) mRNAs were isolated from the indicated brain tissues. qRT-PCR analysis showed expression of both AKAP5 and AKAP7 genes in the dLGN.
Figure 3
Figure 3. Identification of CDI in TC neurons.
(A) Scheme of the double-pulse protocol used to elicit HVA Ca2+ currents. TC neurons were held at −40 mV and conditioning pulses to varying potentials (−40 to +60 mV, 200 ms duration) were followed by a brief gap (−40 mV, 50 ms) and a subsequent analyzing test pulse to a fixed potential of +10 mV (200 ms). (B) Family of representative current traces elicited by the pulse protocol shown in (A). (C) Dinact equation for calculating effects of CDI in TC neurons.
Figure 4
Figure 4. β2AR specifically modulates CDI in TC neurons of dLGN.
(A) Representative current traces recorded under control conditions (upper left panel) and during extracellular application of specific β2AR agonist salmeterol (10 µM) plus antagonists for the other two types of receptor (CGP 20712 dihydrochloride-β1 antagonist and SR 59230A hydrochloride-β3-antagonist, 100 µM each; lower left panel) elicited by the indicated pulse protocol (middle left panel). The bar graph (right panel) represents Dinact under different recording conditions (as indicated). The mean value of four cells recorded under control conditions was taken for comparison with four cells recorded under 10 µM salmeterol plus 100 µM β13 antagonists. Data are presented as means ± SEM of several independent experiments. **P<0.01. Significance of salmeterol plus antagonists versus control was calculated by Student's t test. The degree of inactivation is given by the normalized current amplitude of the mean postpulse I/V at +10 mV. (B) Immunocytochemical analysis of primary cultures of the dorsal thalamus using MAP2 specific antibody (left upper panel, red) and β2AR specific antibody (left down panel, green). The merged picture revealed the co-expression of these two proteins in somatic regions and proximal dendrites. Enlarged inlay represents magnification of the area indicated by the rectangle. Yellow dots represent places were these two proteins are in close proximity. Data shown are representative pictures from several independent immunostainings and preparations of neurons. In all cases, omission of primary antibodies resulted in no fluorescence signal above background (negative control).
Figure 5
Figure 5. Inhibition of PKA completely suppresses the effect of βAR stimulation on CDI in TC neurons.
(A) Representative current traces recorded under control conditions (upper left panel) and in the presence of the specific β2AR agonist salmeterol alone (10 µM; left middle panel) or in combination with PKI 14–22 amide (10 µM; lower left panel). The bar graph represents Dinact under different recording conditions (as indicated). The mean value of five cells recorded under control conditions was taken for comparison with four cells recorded under 10 µM salmeterol and five cells recorded under 10 µM salmeterol plus PKI 14–22 amide. Data are presented as means ± SEM of several independent experiments. ***P<0.001. Significance of salmeterol plus PKI (n = 5) versus salmeterol alone (n = 4) was calculated by Student's t test. The degree of inactivation is given by the normalized current amplitude of the mean postpulse I/V at +10 mV. (B) Close co-expression of the main modulator of CDI, PKA (green) and CaV1.2 (red) in cultured neurons. Yellow dots represent places were these two proteins are in close proximity. Data shown are representative pictures from several independent immunostainings and preparations of neurons. In all cases, omission of primary antibodies resulted without signal (negative control). (C) Indicated brain regions were immunostained with antibodies specific for PKARIIβ and CaV1.2. Thalamic regions LGN and VB revealed very strong interaction patterns in merged pictures. Association of these proteins is still present in hippocampus but on lower level. DG (dentate gyrus), PoDG (polymorph layer of the dentate gyrus).
Figure 6
Figure 6. Inhibition of PKA binding to AKAPs suppresses the effect of βAR stimulation in TC neurons.
(A) Representative current traces recorded under control conditions (upper left panel) and in the presence of the specific β2AR agonist salmeterol alone (10 µM; left middle panel) or in combination with InCELLect™ AKAP St-Ht31 inhibitory peptide (10 µM; lower left panel). (B) The bar graph represents Dinact under different recording conditions (as indicated). The mean value of four cells recorded under control conditions was taken for comparison with four cells recorded under 10 µM salmeterol and nine cells recorded under 10 µM salmeterol plus InCELLect™ AKAP St-Ht31 inhibitory peptide. Data are presented as means ± SEM of several independent experiments. **P<0.01. Significance of salmeterol (n = 4) versus salmeterol plus InCELLect™ AKAP St-Ht31 inhibitory peptide (n = 9) was calculated by Student's t test. The degree of inactivation is given by the normalized current amplitude of the mean postpulse I/V at +10 mV.
Figure 7
Figure 7. Interaction partners important for CDI modulation in TC neurons.
(A) Immunocytochemical analysis of primary cultures of the dorsal thalamus using CaV1.2- (red), AKAP150- (green) and PKARIIβ- (blue) specific antibodies. Merged picture shows the close connection of the components of the proposed ternary complex, especially in somatic regions and proximal dendrites. Enlarged inlay represents a magnification of the area indicated by the rectangle. Data shown are representative pictures from several independent immunostainings and preparations of neurons. In all cases, omission of primary antibodies resulted without signal (negative control). Western blot analysis and pull down assays were done as described in "Methods". (B) Interaction of AKAP7-MBP and PKARIIβ-c-myc was detected using antibodies against c-myc. (C) IP of PKARIIβ-c-myc and AKAP5-GFP detected after incubation with GFP-coupled magnetic beads using antibodies derived against PKARIIβ. (D) Existence of PKA holoenzyme consisting of PKARIIβ-GST and PKAcsβ-GFP was detected with antibodies against GFP protein.
Figure 8
Figure 8. The role of dephosphorylation processes in CDI modulation of TC neurons.
(A) Representative current traces recorded under control conditions (upper left panel) and in the presence of okadaic acid (OA) (10 µM; left down panel). The bar graph (right panel) represents Dinact under different recording conditions (as indicated). The mean value of three cells recorded under control conditions was taken for comparison with three cells recorded under 10 µM OA. (B) Representative current traces recorded under control conditions (upper left panel) and in the presence of the isoproterenol alone (10 µM; left middle panel) or in combination with OA (10 µM; lower left panel). The bar graph (right panel) represents Dinact under different recording conditions (as indicated). The mean value of five cells recorded under control conditions was taken for comparison with five cells recorded under 10 µM isoproterenol and five cells recorded under isoproterenol plus OA. Data are presented as means ± SEM of several independent experiments. ***P<0.001. Significance of isoproterenol plus OA (n = 5) versus controls (n = 5) was calculated by Student's t test. **P<0.01. Significance of isoproterenol (n = 5) versus isoproterenol plus OA (n = 5) was calculated by Student's t test. The degree of inactivation is given by the normalized current amplitude of the mean postpulse I/V at +10 mV. (C) Immunocytochemical analysis of primary cultures of the dorsal thalamus using CaV1.2- (left panel, green) and PP2A-specific antibodies (right panel, red). Merge picture showed close association of the two proteins, especially in somatic regions and proximal dendrites. Data shown are representative pictures from several independent immunostainings and thalamic neurons preparations. In all cases, omission of primary antibodies resulted in no fluorescence signal above background (negative control).

Similar articles

Cited by

References

    1. Lacinova L. Voltage-dependent calcium channels. Gen Physiol Biophys. 2005;24(Suppl 1):1–78. - PubMed
    1. Berridge MJ, Lipp P, Bootman MD. The versatility and universality of calcium signalling. Nat Rev Mol Cell Biol. 2000;1:11–21. - PubMed
    1. Budde T, Meuth S, Pape HC. Calcium-dependent inactivation of neuronal calcium channels. Nat Rev Neurosci. 2002;3:873–883. - PubMed
    1. Bardo S, Cavazzini MG, Emptage N. The role of the endoplasmic reticulum Ca2+ store in the plasticity of central neurons. Trends Pharmacol Sci. 2006;27:78–84. - PubMed
    1. Rankovic V, Ehling P, Coulon P, Landgraf P, Kreutz MR, et al. Intracellular Ca2+ release-dependent inactivation of Ca2+ currents in thalamocortical relay neurons. Eur J Neurosci. 2010;31:439–449. - PubMed

Publication types