

MAP4 mechanism that stabilizes mitochondrial permeability transition in hypoxia: microtubule enhancement and DYNLT1 interaction with VDAC1
- PMID: 22164227
- PMCID: PMC3229508
- DOI: 10.1371/journal.pone.0028052
MAP4 mechanism that stabilizes mitochondrial permeability transition in hypoxia: microtubule enhancement and DYNLT1 interaction with VDAC1
Abstract
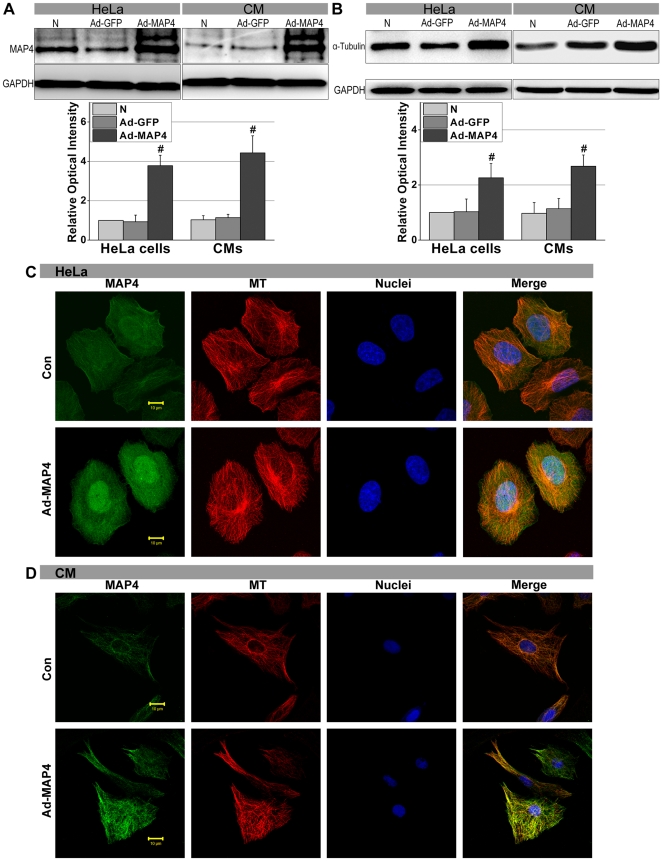
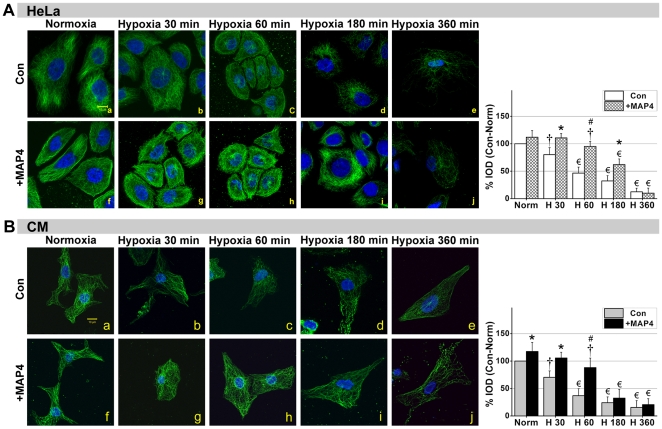
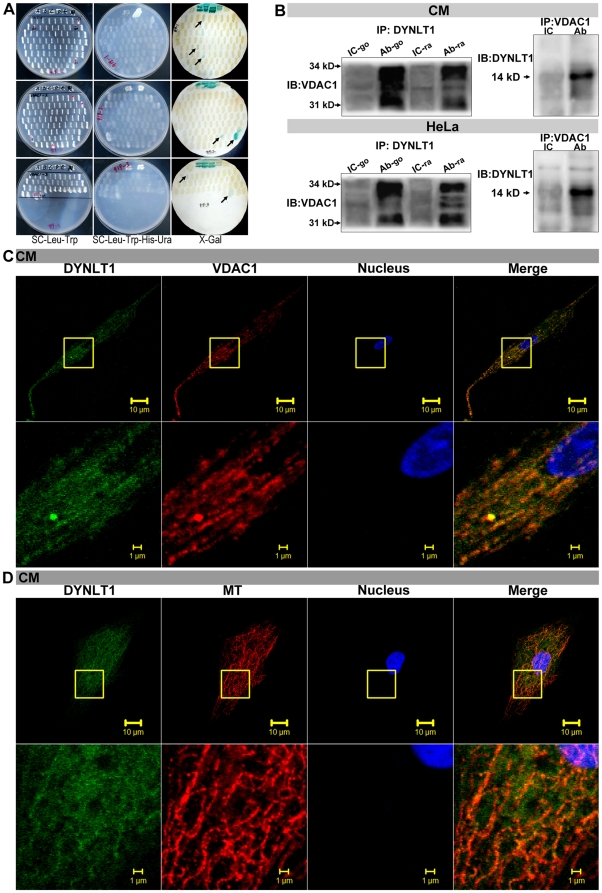
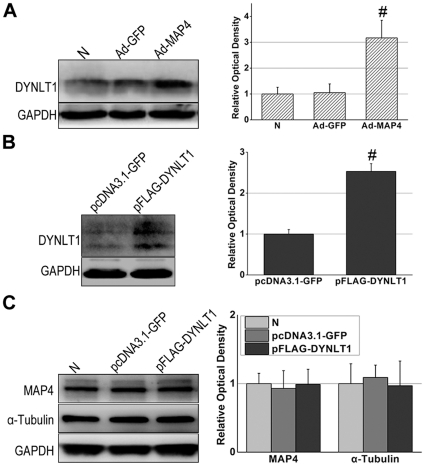
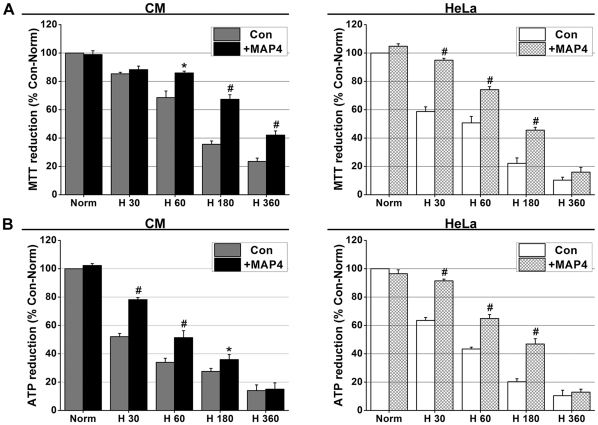
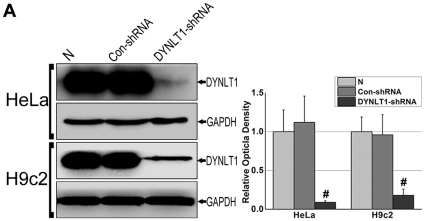
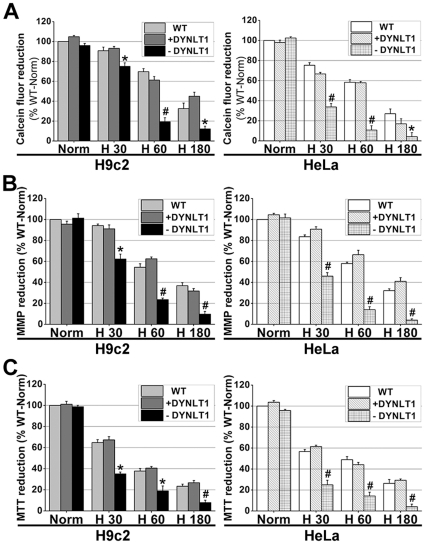
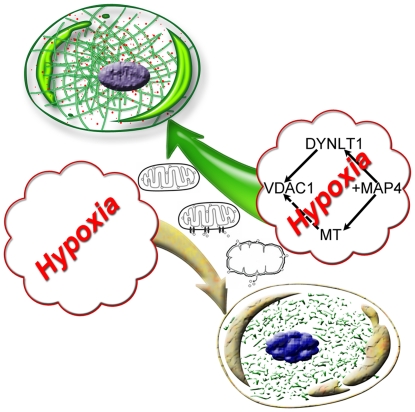
Mitochondrial membrane permeability has received considerable attention recently because of its key role in apoptosis and necrosis induced by physiological events such as hypoxia. The manner in which mitochondria interact with other molecules to regulate mitochondrial permeability and cell destiny remains elusive. Previously we verified that hypoxia-induced phosphorylation of microtubule-associated protein 4 (MAP4) could lead to microtubules (MTs) disruption. In this study, we established the hypoxic (1% O(2)) cell models of rat cardiomyocytes, H9c2 and HeLa cells to further test MAP4 function. We demonstrated that increase in the pool of MAP4 could promote the stabilization of MT networks by increasing the synthesis and polymerization of tubulin in hypoxia. Results showed MAP4 overexpression could enhance cell viability and ATP content under hypoxic conditions. Subsequently we employed a yeast two-hybrid system to tag a protein interacting with mitochondria, dynein light chain Tctex-type 1 (DYNLT1), by hVDAC1 bait. We confirmed that DYNLT1 had protein-protein interactions with voltage-dependent anion channel 1 (VDAC1) using co-immunoprecipitation; and immunofluorescence technique showed that DYNLT1 was closely associated with MTs and VDAC1. Furthermore, DYNLT1 interactions with MAP4 were explored using a knockdown technique. We thus propose two possible mechanisms triggered by MAP4: (1) stabilization of MT networks, (2) DYNLT1 modulation, which is connected with VDAC1, and inhibition of hypoxia-induced mitochondrial permeabilization.
Conflict of interest statement
Figures
Similar articles
-
Phosphorylation of DYNLT1 at serine 82 regulates microtubule stability and mitochondrial permeabilization in hypoxia.Mol Cells. 2013 Oct;36(4):322-32. doi: 10.1007/s10059-013-0114-x. Epub 2013 Oct 22. Mol Cells. 2013. PMID: 24170091 Free PMC article.
-
DYNLT1 promotes mitochondrial metabolism to fuel breast cancer development by inhibiting ubiquitination degradation of VDAC1.Mol Med. 2023 Jun 6;29(1):72. doi: 10.1186/s10020-023-00663-0. Mol Med. 2023. PMID: 37280526 Free PMC article.
-
The p38/MAPK pathway regulates microtubule polymerization through phosphorylation of MAP4 and Op18 in hypoxic cells.Cell Mol Life Sci. 2010 Jan;67(2):321-33. doi: 10.1007/s00018-009-0187-z. Epub 2009 Nov 14. Cell Mol Life Sci. 2010. PMID: 19915797 Free PMC article.
-
The mitochondrial voltage-dependent anion channel 1 in tumor cells.Biochim Biophys Acta. 2015 Oct;1848(10 Pt B):2547-75. doi: 10.1016/j.bbamem.2014.10.040. Epub 2014 Nov 4. Biochim Biophys Acta. 2015. PMID: 25448878 Review.
-
Targeting putative components of the mitochondrial permeability transition pore for novel therapeutics.Biochem Pharmacol. 2020 Jul;177:113995. doi: 10.1016/j.bcp.2020.113995. Epub 2020 Apr 25. Biochem Pharmacol. 2020. PMID: 32339494 Review.
Cited by
-
Non-Overlapping Distributions and Functions of the VDAC Family in Ciliogenesis.Cells. 2015 Jul 31;4(3):331-53. doi: 10.3390/cells4030331. Cells. 2015. PMID: 26264029 Free PMC article.
-
Microtubule acetylation dyshomeostasis in Parkinson's disease.Transl Neurodegener. 2023 May 8;12(1):20. doi: 10.1186/s40035-023-00354-0. Transl Neurodegener. 2023. PMID: 37150812 Free PMC article. Review.
-
MAP4 as a New Candidate in Cardiovascular Disease.Front Physiol. 2020 Aug 26;11:1044. doi: 10.3389/fphys.2020.01044. eCollection 2020. Front Physiol. 2020. PMID: 32982783 Free PMC article. Review.
-
An Emerging Role for Tubulin Isotypes in Modulating Cancer Biology and Chemotherapy Resistance.Int J Mol Sci. 2017 Jul 4;18(7):1434. doi: 10.3390/ijms18071434. Int J Mol Sci. 2017. PMID: 28677634 Free PMC article. Review.
-
Multi-Allelic Mitochondrial DNA Deletions in an Adult Dog with Chronic Weakness, Exercise Intolerance and Lactic Acidemia.Animals (Basel). 2024 Jun 30;14(13):1946. doi: 10.3390/ani14131946. Animals (Basel). 2024. PMID: 38998058 Free PMC article.
References
-
- Henze K, Martin W. Evolutionary biology: essence of mitochondria. Nature. 2003;426:127–128. - PubMed
-
- McBride HM, Neuspiel M, Wasiak S. Mitochondria: More than just a powerhouse. Curr Biol. 2006;16:R551–R560. - PubMed
-
- Lesnefsky EJ, Moghaddas S, Tandler B, Kerner J, Hoppel CL. Mitochondrial dysfunction in cardiac disease: ischemia–reperfusion, aging, and heart failure. J Mol Cell Cardiol. 2001;33:1065–1089. - PubMed
-
- Cao LC, Honeyman TW, Cooney R, Kennington L, Scheid CR, et al. Mitochondrial dysfunction is a primary event in renal cell oxalate toxicity. Kidney Int. 2004;66:1890–1900. - PubMed
Publication types
MeSH terms
Substances
LinkOut - more resources
Full Text Sources
Molecular Biology Databases
