Engineering genetically encoded nanosensors for real-time in vivo measurements of citrate concentrations
- PMID: 22164251
- PMCID: PMC3229521
- DOI: 10.1371/journal.pone.0028245
Engineering genetically encoded nanosensors for real-time in vivo measurements of citrate concentrations
Abstract
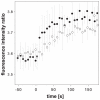
Citrate is an intermediate in catabolic as well as biosynthetic pathways and is an important regulatory molecule in the control of glycolysis and lipid metabolism. Mass spectrometric and NMR based metabolomics allow measuring citrate concentrations, but only with limited spatial and temporal resolution. Methods are so far lacking to monitor citrate levels in real-time in-vivo. Here, we present a series of genetically encoded citrate sensors based on Förster resonance energy transfer (FRET). We screened databases for citrate-binding proteins and tested three candidates in vitro. The citrate binding domain of the Klebsiella pneumoniae histidine sensor kinase CitA, inserted between the FRET pair Venus/CFP, yielded a sensor highly specific for citrate. We optimized the peptide linkers to achieve maximal FRET change upon citrate binding. By modifying residues in the citrate binding pocket, we were able to construct seven sensors with different affinities spanning a concentration range of three orders of magnitude without losing specificity. In a first in vivo application we show that E. coli maintains the capacity to take up glucose or acetate within seconds even after long-term starvation.
Conflict of interest statement
Figures


Similar articles
-
Designing, construction and characterization of genetically encoded FRET-based nanosensor for real time monitoring of lysine flux in living cells.J Nanobiotechnology. 2016 Jun 22;14(1):49. doi: 10.1186/s12951-016-0204-y. J Nanobiotechnology. 2016. PMID: 27334743 Free PMC article.
-
Genetically encoded FRET-based nanosensor for in vivo measurement of leucine.Biosens Bioelectron. 2013 Dec 15;50:72-7. doi: 10.1016/j.bios.2013.06.028. Epub 2013 Jun 24. Biosens Bioelectron. 2013. PMID: 23835220
-
CitA/CitB two-component system regulating citrate fermentation in Escherichia coli and its relation to the DcuS/DcuR system in vivo.J Bacteriol. 2012 Feb;194(3):636-45. doi: 10.1128/JB.06345-11. Epub 2011 Nov 18. J Bacteriol. 2012. PMID: 22101843 Free PMC article.
-
Recent Advances in Development of Genetically Encoded Fluorescent Sensors.Methods Enzymol. 2017;589:1-49. doi: 10.1016/bs.mie.2017.01.019. Epub 2017 Mar 9. Methods Enzymol. 2017. PMID: 28336060 Review.
-
Recent developments of genetically encoded optical sensors for cell biology.Biol Cell. 2017 Jan;109(1):1-23. doi: 10.1111/boc.201600040. Epub 2016 Oct 14. Biol Cell. 2017. PMID: 27628952 Review.
Cited by
-
Engineering genetically encoded FRET-based nanosensors for real time display of arsenic (As3+) dynamics in living cells.Sci Rep. 2019 Aug 2;9(1):11240. doi: 10.1038/s41598-019-47682-8. Sci Rep. 2019. PMID: 31375744 Free PMC article.
-
Metabolic FRET sensors in intact organs: Applying spectral unmixing to acquire reliable signals.Biol Open. 2023 Oct 15;12(10):bio060030. doi: 10.1242/bio.060030. Epub 2023 Oct 5. Biol Open. 2023. PMID: 37671927 Free PMC article.
-
Bacterial Vivisection: How Fluorescence-Based Imaging Techniques Shed a Light on the Inner Workings of Bacteria.Microbiol Mol Biol Rev. 2020 Oct 28;84(4):e00008-20. doi: 10.1128/MMBR.00008-20. Print 2020 Nov 18. Microbiol Mol Biol Rev. 2020. PMID: 33115939 Free PMC article. Review.
-
Recent progress in developing fluorescent probes for imaging cell metabolites.Biomed Mater. 2021 May 24;16(4):10.1088/1748-605X/abfd11. doi: 10.1088/1748-605X/abfd11. Biomed Mater. 2021. PMID: 33915523 Free PMC article. Review.
-
Dynamic single-cell NAD(P)H measurement reveals oscillatory metabolism throughout the E. coli cell division cycle.Sci Rep. 2018 Feb 1;8(1):2162. doi: 10.1038/s41598-018-20550-7. Sci Rep. 2018. PMID: 29391569 Free PMC article.
References
Publication types
MeSH terms
Substances
Grants and funding
LinkOut - more resources
Full Text Sources
Research Materials
Miscellaneous

