

The dichotomy in degree correlation of biological networks
- PMID: 22164269
- PMCID: PMC3229552
- DOI: 10.1371/journal.pone.0028322
The dichotomy in degree correlation of biological networks
Abstract
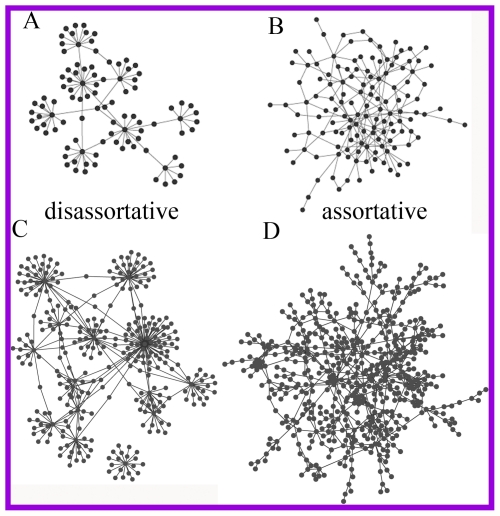
Most complex networks from different areas such as biology, sociology or technology, show a correlation on node degree where the possibility of a link between two nodes depends on their connectivity. It is widely believed that complex networks are either disassortative (links between hubs are systematically suppressed) or assortative (links between hubs are enhanced). In this paper, we analyze a variety of biological networks and find that they generally show a dichotomous degree correlation. We find that many properties of biological networks can be explained by this dichotomy in degree correlation, including the neighborhood connectivity, the sickle-shaped clustering coefficient distribution and the modularity structure. This dichotomy distinguishes biological networks from real disassortative networks or assortative networks such as the Internet and social networks. We suggest that the modular structure of networks accounts for the dichotomy in degree correlation and vice versa, shedding light on the source of modularity in biological networks. We further show that a robust and well connected network necessitates the dichotomy of degree correlation, suggestive of an evolutionary motivation for its existence. Finally, we suggest that a dichotomous degree correlation favors a centrally connected modular network, by which the integrity of network and specificity of modules might be reconciled.
Conflict of interest statement
Figures
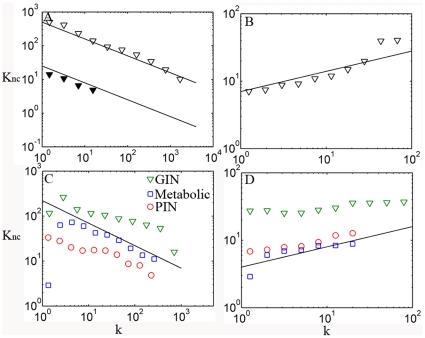
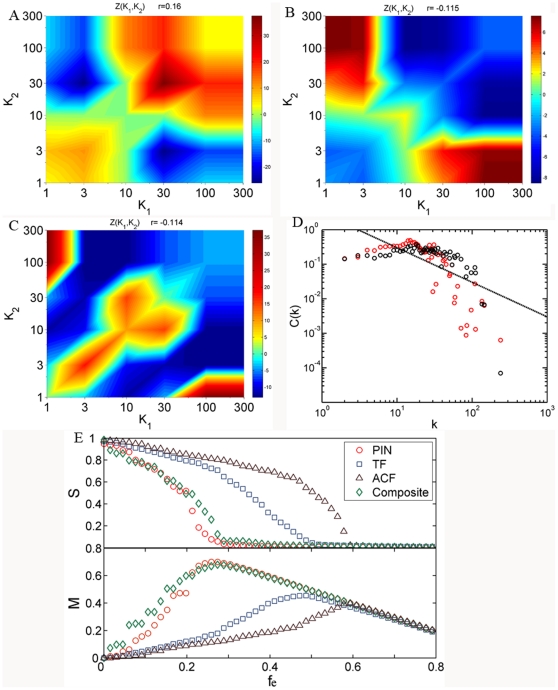
 ; the solid lines in B and D correspond to
  . Note that the solid lines in C and D are not fitted to biological networks; they are drawn to compare with Internet and social network.
Similar articles
-
Revisiting the variation of clustering coefficient of biological networks suggests new modular structure.BMC Syst Biol. 2012 May 1;6:34. doi: 10.1186/1752-0509-6-34. BMC Syst Biol. 2012. PMID: 22548803 Free PMC article.
-
In search of the biological significance of modular structures in protein networks.PLoS Comput Biol. 2007 Jun;3(6):e107. doi: 10.1371/journal.pcbi.0030107. Epub 2007 Apr 30. PLoS Comput Biol. 2007. PMID: 17542644 Free PMC article.
-
Assortative mixing in networks.Phys Rev Lett. 2002 Nov 11;89(20):208701. doi: 10.1103/PhysRevLett.89.208701. Epub 2002 Oct 28. Phys Rev Lett. 2002. PMID: 12443515
-
Concurrency and network disassortativity.Artif Life. 2010 Summer;16(3):225-32. doi: 10.1162/artl_a_00001. Artif Life. 2010. PMID: 20586579
-
Detecting hierarchical modularity in biological networks.Methods Mol Biol. 2009;541:145-60. doi: 10.1007/978-1-59745-243-4_7. Methods Mol Biol. 2009. PMID: 19381526 Review.
Cited by
-
CompNet: a GUI based tool for comparison of multiple biological interaction networks.BMC Bioinformatics. 2016 Apr 26;17(1):185. doi: 10.1186/s12859-016-1013-x. BMC Bioinformatics. 2016. PMID: 27112575 Free PMC article.
-
Co-Expression Network Models Suggest that Stress Increases Tolerance to Mutations.Sci Rep. 2015 Nov 16;5:16726. doi: 10.1038/srep16726. Sci Rep. 2015. PMID: 26568486 Free PMC article.
-
Artificial intelligence in cancer target identification and drug discovery.Signal Transduct Target Ther. 2022 May 10;7(1):156. doi: 10.1038/s41392-022-00994-0. Signal Transduct Target Ther. 2022. PMID: 35538061 Free PMC article. Review.
-
Examining indicators of complex network vulnerability across diverse attack scenarios.Sci Rep. 2023 Oct 24;13(1):18208. doi: 10.1038/s41598-023-45218-9. Sci Rep. 2023. PMID: 37875564 Free PMC article.
-
Mild traumatic brain injury history is associated with lower brain network resilience in soldiers.Brain Commun. 2023 Jul 27;5(4):fcad201. doi: 10.1093/braincomms/fcad201. eCollection 2023. Brain Commun. 2023. PMID: 37545546 Free PMC article.
References
-
- Barabasi AL, Oltvai ZN. Network biology: understanding the cell's functional organization. Nat Rev Genet. 2004;5:101–113. - PubMed
-
- Jeong H, Mason SP, Barabasi AL, Oltvai ZN. Lethality and centrality in protein networks. Nature. 2001;411:41–42. - PubMed
-
- Newman ME. Assortative mixing in networks. Phys Rev Lett. 2002;89:208701. - PubMed
-
- Maslov S, Sneppen K. Specificity and stability in topology of protein networks. Science. 2002;296:910–913. - PubMed
-
- Park J, Newman ME. Statistical mechanics of networks. Phys Rev E Stat Nonlin Soft Matter Phys. 2004;70:066117. - PubMed
Publication types
MeSH terms
Substances
LinkOut - more resources
Full Text Sources
