The tyrosine kinase inhibitor dasatinib induces a marked adipogenic differentiation of human multipotent mesenchymal stromal cells
- PMID: 22164306
- PMCID: PMC3229607
- DOI: 10.1371/journal.pone.0028555
The tyrosine kinase inhibitor dasatinib induces a marked adipogenic differentiation of human multipotent mesenchymal stromal cells
Abstract
Background: The introduction of specific BCR-ABL inhibitors in chronic myelogenous leukemia therapy has entirely mutated the prognosis of this hematologic cancer from being a fatal disorder to becoming a chronic disease. Due to the probable long lasting treatment with tyrosine-kinase inhibitors (TKIs), the knowledge of their effects on normal cells is of pivotal importance.
Design and methods: We investigated the effects of dasatinib treatment on human bone marrow-derived mesenchymal stromal cells (MSCs).
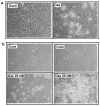
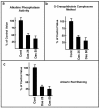
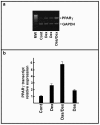
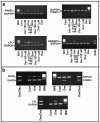
Results: Our findings demonstrate, for the first time, that dasatinib induces MSCs adipocytic differentiation. Particularly, when the TKI is added to the medium inducing osteogenic differentiation, a high MSCs percentage acquires adipocytic morphology and overexpresses adipocytic specific genes, including PPARγ, CEBPα, LPL and SREBP1c. Dasatinib also inhibits the activity of alkaline phosphatase, an osteogenic marker, and remarkably reduces matrix mineralization. The increase of PPARγ is also confirmed at protein level. The component of osteogenic medium required for dasatinib-induced adipogenesis is dexamethasone. Intriguingly, the increase of adipocytic markers is also observed in MSCs treated with dasatinib alone. The TKI effect is phenotype-specific, since fibroblasts do not undergo adipocytic differentiation or PPARγ increase.
Conclusions: Our data demonstrate that dasatinib treatment affects bone marrow MSCs commitment and suggest that TKIs therapy might modify normal phenotypes with potential significant negative consequences.
Conflict of interest statement
Figures


Similar articles
-
The Src inhibitor dasatinib accelerates the differentiation of human bone marrow-derived mesenchymal stromal cells into osteoblasts.BMC Cancer. 2010 Jun 17;10:298. doi: 10.1186/1471-2407-10-298. BMC Cancer. 2010. PMID: 20565769 Free PMC article.
-
Effects of second-generation tyrosine kinase inhibitors towards osteogenic differentiation of human mesenchymal cells of healthy donors.Hematol Oncol. 2012 Mar;30(1):27-33. doi: 10.1002/hon.988. Epub 2011 May 5. Hematol Oncol. 2012. PMID: 21544849
-
Intermittent treatment with parathyroid hormone (PTH) as well as a non-peptide small molecule agonist of the PTH1 receptor inhibits adipocyte differentiation in human bone marrow stromal cells.Bone. 2006 Dec;39(6):1361-72. doi: 10.1016/j.bone.2006.06.010. Epub 2006 Aug 10. Bone. 2006. PMID: 16904389
-
Dasatinib: a tyrosine kinase inhibitor for the treatment of chronic myelogenous leukemia and philadelphia chromosome-positive acute lymphoblastic leukemia.Clin Ther. 2007 Nov;29(11):2289-308. doi: 10.1016/j.clinthera.2007.11.005. Clin Ther. 2007. PMID: 18158072 Review.
-
Tyrosine kinase inhibitors and mesenchymal stromal cells: effects on self-renewal, commitment and functions.Oncotarget. 2017 Jan 17;8(3):5540-5565. doi: 10.18632/oncotarget.12649. Oncotarget. 2017. PMID: 27750212 Free PMC article. Review.
Cited by
-
A Shortcut from Genome to Drug: The Employment of Bioinformatic Tools to Find New Targets for Gastric Cancer Treatment.Pharmaceutics. 2023 Sep 12;15(9):2303. doi: 10.3390/pharmaceutics15092303. Pharmaceutics. 2023. PMID: 37765273 Free PMC article.
-
Application of High-Throughput Assays to Examine Phospho-Modulation of the Late Steps of Regulated Exocytosis.High Throughput. 2017 Nov 13;6(4):17. doi: 10.3390/ht6040017. High Throughput. 2017. PMID: 29479054 Free PMC article.
-
How to Hit Mesenchymal Stromal Cells and Make the Tumor Microenvironment Immunostimulant Rather Than Immunosuppressive.Front Immunol. 2018 Feb 19;9:262. doi: 10.3389/fimmu.2018.00262. eCollection 2018. Front Immunol. 2018. PMID: 29515580 Free PMC article. Review.
-
Impact of the uremic milieu on the osteogenic potential of mesenchymal stem cells.PLoS One. 2015 Jan 30;10(1):e0116468. doi: 10.1371/journal.pone.0116468. eCollection 2015. PLoS One. 2015. PMID: 25635832 Free PMC article.
-
Dasatinib inhibits primary melanoma cell proliferation through morphology-dependent disruption of Src-ERK signaling.Oncol Lett. 2013 Feb;5(2):527-532. doi: 10.3892/ol.2012.1066. Epub 2012 Dec 10. Oncol Lett. 2013. PMID: 23420605 Free PMC article.
References
-
- Radich JP. Chronic Myeloid Leukemia 2010: Where Are We Now and Where Can We Go? Hematology Am Soc Hematol Educ Program. 2010;2010:122–128. - PubMed
-
- An X, Tiwaria AK, Suna Y, Dinga P-R, Ashby CR, Jr, et al. BCR-ABL tyrosine kinase inhibitors in the treatment of Philadelphia chromosome positive chronic myeloid leukemia: A review. Leuk Res. 2010;34:1255–1268. - PubMed
-
- Kantarjian HM, Giles F, Quintas-Cardama A, Cortes J. Important therapeutic targets in chronic myelogenous leukemia. Clin Cancer Res. 2007;13:1089–1097. - PubMed
-
- Savage DG, Antman KH. Imatinib mesylate—a new oral targeted therapy. N Engl J Med. 2002;346:683–693. - PubMed
Publication types
MeSH terms
Substances
LinkOut - more resources
Full Text Sources
Miscellaneous

