

Dose-Dependent Change in Elimination Kinetics of Ethanol due to Shift of Dominant Metabolizing Enzyme from ADH 1 (Class I) to ADH 3 (Class III) in Mouse
- PMID: 22164338
- PMCID: PMC3227458
- DOI: 10.1155/2012/408190
Dose-Dependent Change in Elimination Kinetics of Ethanol due to Shift of Dominant Metabolizing Enzyme from ADH 1 (Class I) to ADH 3 (Class III) in Mouse
Abstract
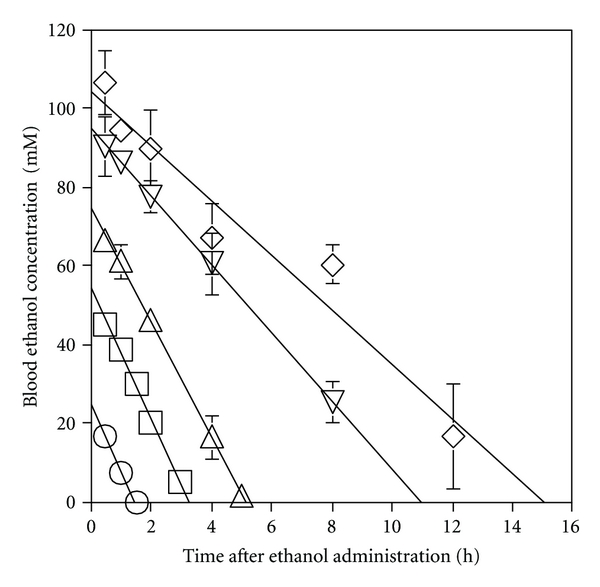
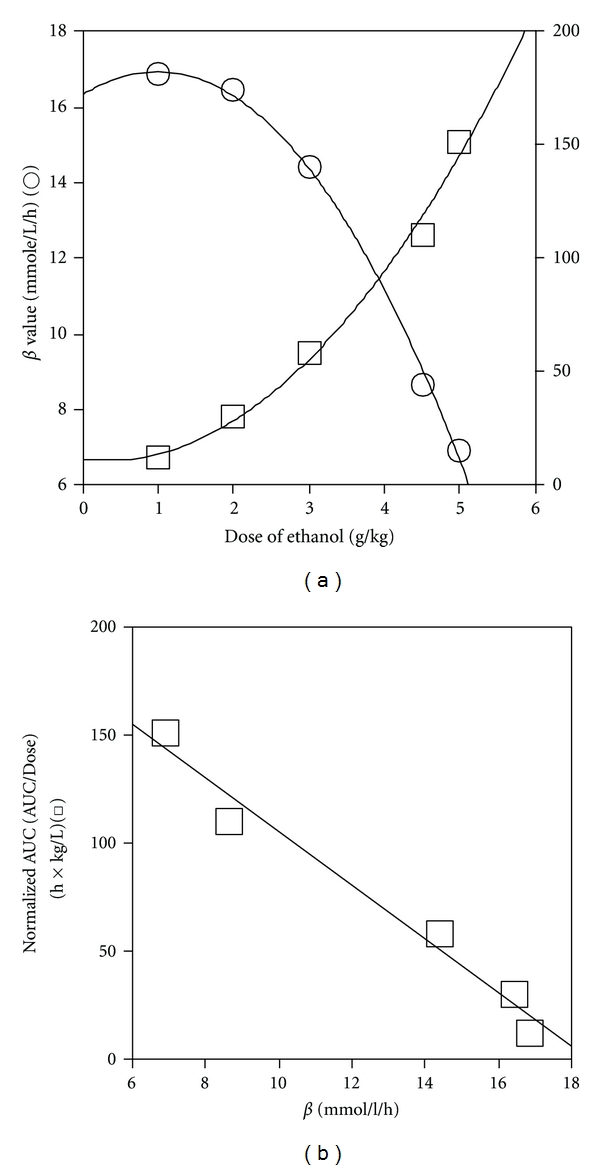
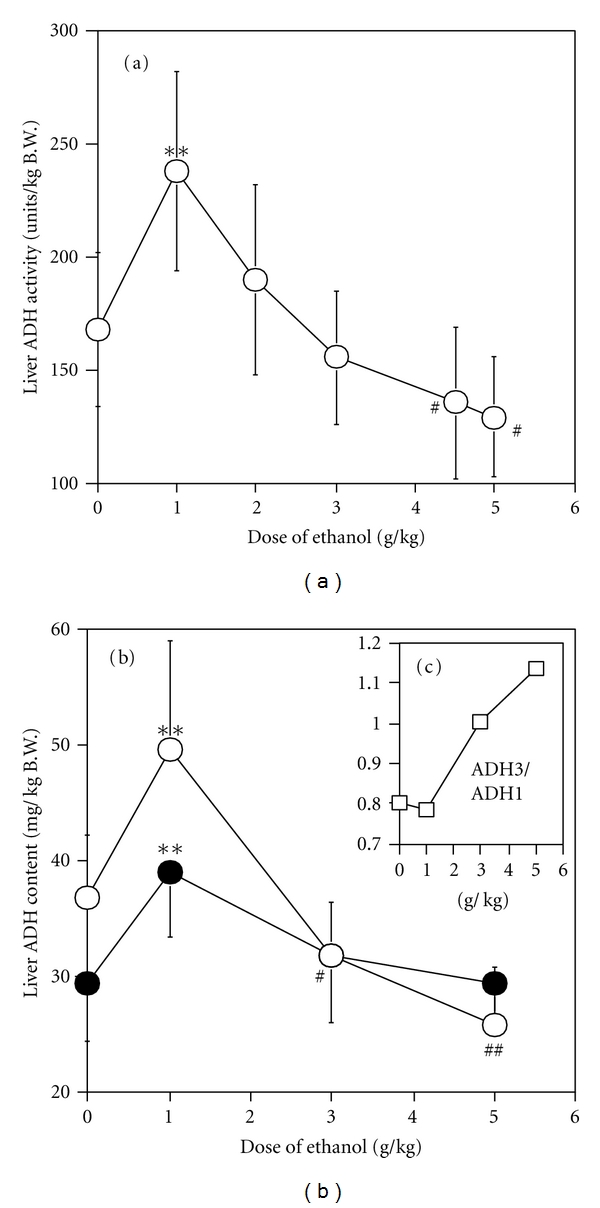
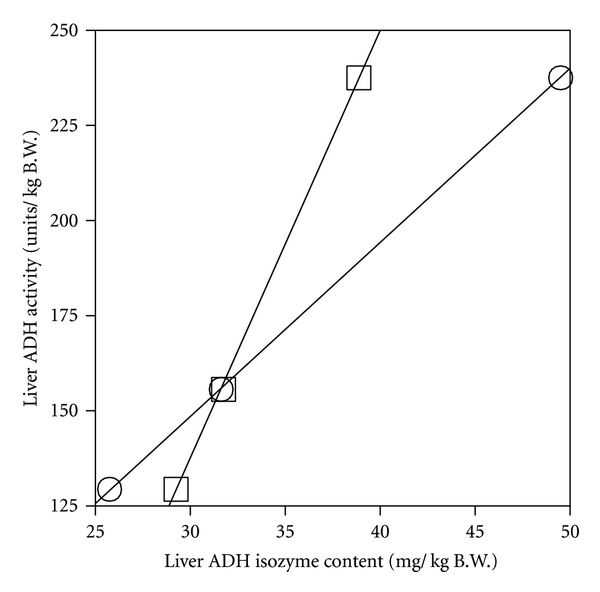
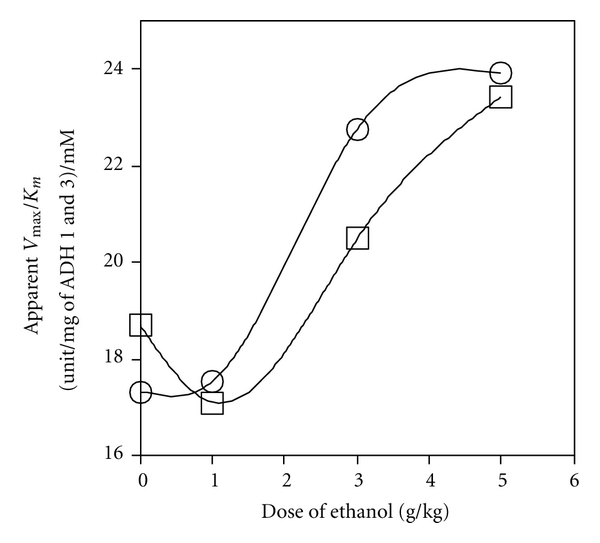
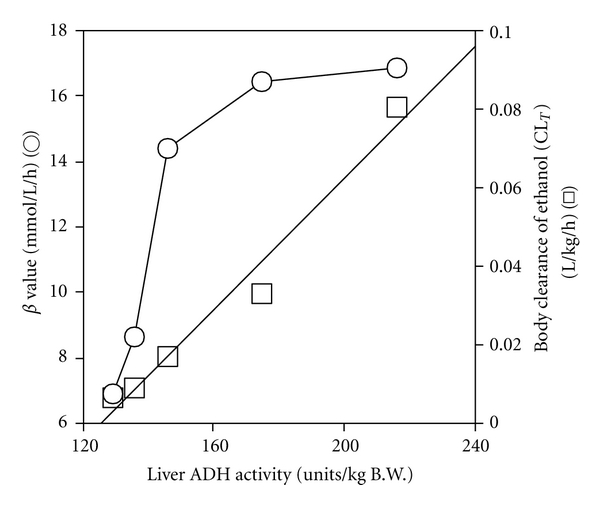
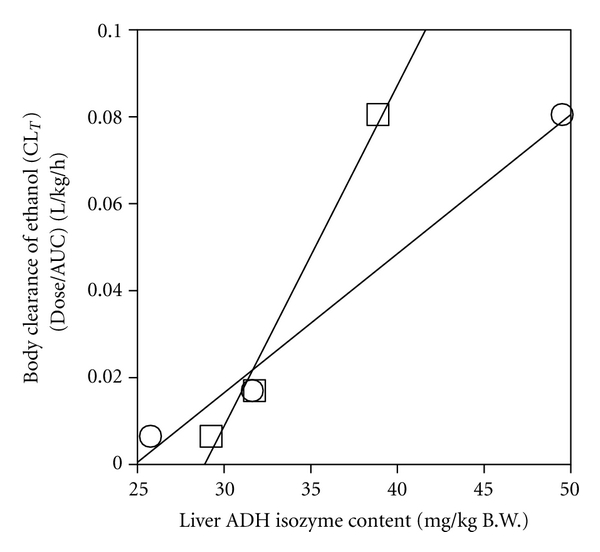
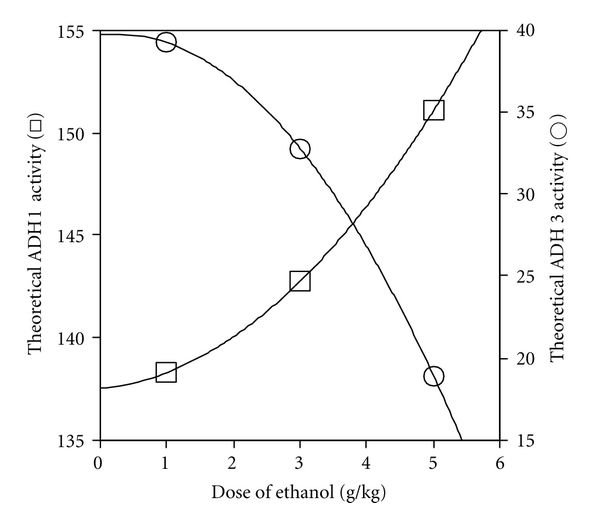
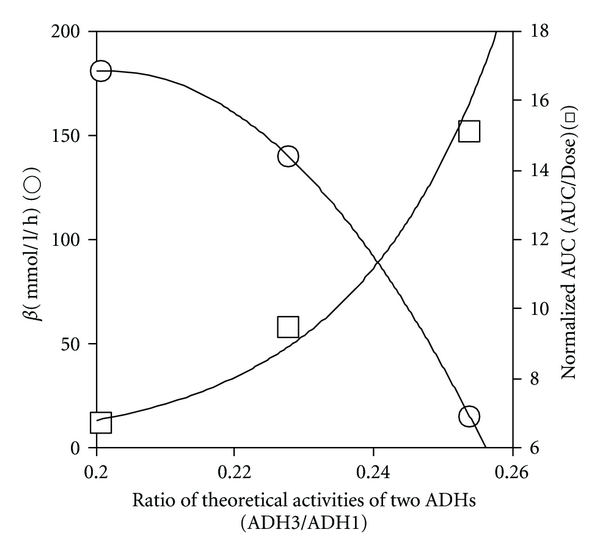
ADH 1 and ADH 3 are major two ADH isozymes in the liver, which participate in systemic alcohol metabolism, mainly distributing in parenchymal and in sinusoidal endothelial cells of the liver, respectively. We investigated how these two ADHs contribute to the elimination kinetics of blood ethanol by administering ethanol to mice at various doses, and by measuring liver ADH activity and liver contents of both ADHs. The normalized AUC (AUC/dose) showed a concave increase with an increase in ethanol dose, inversely correlating with β. CL(T) (dose/AUC) linearly correlated with liver ADH activity and also with both the ADH-1 and -3 contents (mg/kg B.W.). When ADH-1 activity was calculated by multiplying ADH-1 content by its V(max)/mg (4.0) and normalized by the ratio of liver ADH activity of each ethanol dose to that of the control, the theoretical ADH-1 activity decreased dose-dependently, correlating with β. On the other hand, the theoretical ADH-3 activity, which was calculated by subtracting ADH-1 activity from liver ADH activity and normalized, increased dose-dependently, correlating with the normalized AUC. These results suggested that the elimination kinetics of blood ethanol in mice was dose-dependently changed, accompanied by a shift of the dominant metabolizing enzyme from ADH 1 to ADH 3.
Figures
Similar articles
-
Dose and time changes in liver alcohol dehydrogenase (ADH) activity during acute alcohol intoxication involve not only class I but also class III ADH and govern elimination rate of blood ethanol.Leg Med (Tokyo). 2003 Dec;5(4):202-11. doi: 10.1016/s1344-6223(03)00080-4. Leg Med (Tokyo). 2003. PMID: 14602163
-
Alcohol dehydrogenase (ADH) isozymes in the AdhN/AdhN strain of Peromyscus maniculatus (ADH-deermouse) and a possible role of class III ADH in alcohol metabolism.Biochem Genet. 1995 Oct;33(9-10):349-63. doi: 10.1007/BF02399933. Biochem Genet. 1995. PMID: 8748459
-
[A new sight on alcohol metabolism and alcoholism--role of high Km alcohol dehydrogenase ADH3 (Class III)].Nihon Arukoru Yakubutsu Igakkai Zasshi. 2009 Apr;44(2):78-93. Nihon Arukoru Yakubutsu Igakkai Zasshi. 2009. PMID: 19489444 Review. Japanese.
-
Baboon alcohol dehydrogenase isozymes: phenotypic changes in liver following chronic consumption of alcohol.Isozymes Curr Top Biol Med Res. 1987;16:1-20. Isozymes Curr Top Biol Med Res. 1987. PMID: 3610585
-
[Molecular evidences of non-ADH pathway in alcohol metabolism and Class III alcohol dehydrogenase (ADH3)].Nihon Arukoru Yakubutsu Igakkai Zasshi. 2014 Jun;49(3):159-68. Nihon Arukoru Yakubutsu Igakkai Zasshi. 2014. PMID: 25223084 Review. Japanese.
Cited by
-
Class III Alcohol Dehydrogenase Modulates Renal Parietal Epithelial Cell Transformation During Chronic Alcohol Consumption in Mice.Int J Mol Sci. 2025 Jun 29;26(13):6279. doi: 10.3390/ijms26136279. Int J Mol Sci. 2025. PMID: 40650057 Free PMC article.
-
The Association between Ethanol Elimination Rate and Hangover Severity.Int J Environ Res Public Health. 2020 Jun 17;17(12):4324. doi: 10.3390/ijerph17124324. Int J Environ Res Public Health. 2020. PMID: 32560357 Free PMC article.
-
ALDH2 and ADH1 genetic polymorphisms may contribute to the risk of gastric cancer: a meta-analysis.PLoS One. 2014 Mar 14;9(3):e88779. doi: 10.1371/journal.pone.0088779. eCollection 2014. PLoS One. 2014. Retraction in: PLoS One. 2022 Jun 23;17(6):e0270613. doi: 10.1371/journal.pone.0270613. PMID: 24633362 Free PMC article. Retracted.
-
Ethanol Metabolism in the Liver, the Induction of Oxidant Stress, and the Antioxidant Defense System.Antioxidants (Basel). 2022 Jun 26;11(7):1258. doi: 10.3390/antiox11071258. Antioxidants (Basel). 2022. PMID: 35883749 Free PMC article. Review.
-
Genome-wide association discoveries of alcohol dependence.Am J Addict. 2014 Nov-Dec;23(6):526-39. doi: 10.1111/j.1521-0391.2014.12147.x. Am J Addict. 2014. PMID: 25278008 Free PMC article. Review.
References
-
- Lumeng L, Bosron WF, Li TK. Quantitative correlation of ethanol elimination rates in vivo with liver alcohol dehydrogenase activities in fed, fasted and food-restricted rats. Biochemical Pharmacology. 1979;28(9):1547–1551. - PubMed
-
- Crow KE, Hardman MJ. Regulation of rates of ethanol metabolism. In: Crow KE, Batt RD, editors. Regulation of Rates of Ethanol Metabolism. in Human Metabolism of Alcohol, Regulation, Enzymology, and Metabolites of Ethanol. Vol. 11. Boca Raton, Fla, USA: CRC Press; 1989. pp. 3–16.
-
- Haseba T, Kurosu M, Ohno Y. Dose- and time-dependent changes of mouse liver alcohol dehydrogenase (ADH) activity involving both Class I and Class III ADHs after administration of ethanol. Legal Medicine. 2003:202–211. - PubMed
-
- Plapp BV, Leidal KG, Smith RK, Murch BP. Kinetics of inhibition of ethanol metabolism in rats and the rate-limiting role of alcohol dehydrogenase. Archives of Biochemistry and Biophysics. 1984;230(1):30–38. - PubMed
LinkOut - more resources
Full Text Sources
