

High-throughput processing and normalization of one-color microarrays for transcriptional meta-analyses
- PMID: 22166002
- PMCID: PMC3236842
- DOI: 10.1186/1471-2105-12-S10-S2
High-throughput processing and normalization of one-color microarrays for transcriptional meta-analyses
Abstract
Background: Microarray experiments are becoming increasingly common in biomedical research, as is their deposition in publicly accessible repositories, such as Gene Expression Omnibus (GEO). As such, there has been a surge in interest to use this microarray data for meta-analytic approaches, whether to increase sample size for a more powerful analysis of a specific disease (e.g. lung cancer) or to re-examine experiments for reasons different than those examined in the initial, publishing study that generated them. For the average biomedical researcher, there are a number of practical barriers to conducting such meta-analyses such as manually aggregating, filtering and formatting the data. Methods to automatically process large repositories of microarray data into a standardized, directly comparable format will enable easier and more reliable access to microarray data to conduct meta-analyses.
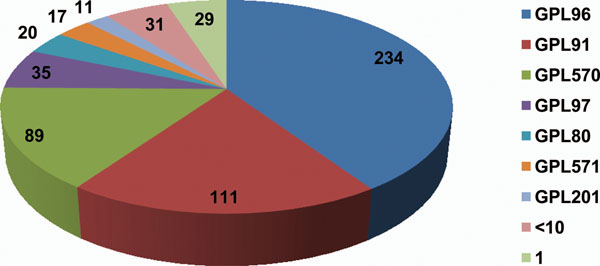
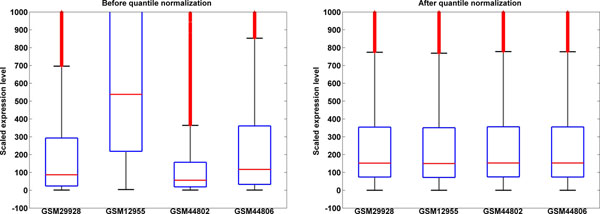
Methods: We present a straightforward, simple but robust against potential outliers method for automatic quality control and pre-processing of tens of thousands of single-channel microarray data files. GEO GDS files are quality checked by comparing parametric distributions and quantile normalized to enable direct comparison of expression level for subsequent meta-analyses.
Results: 13,000 human 1-color experiments were processed to create a single gene expression matrix that subsets can be extracted from to conduct meta-analyses. Interestingly, we found that when conducting a global meta-analysis of gene-gene co-expression patterns across all 13,000 experiments to predict gene function, normalization had minimal improvement over using the raw data.
Conclusions: Normalization of microarray data appears to be of minimal importance on analyses based on co-expression patterns when the sample size is on the order of thousands microarray datasets. Smaller subsets, however, are more prone to aberrations and artefacts, and effective means of automating normalization procedures not only empowers meta-analytic approaches, but aids in reproducibility by providing a standard way of approaching the problem.Data availability: matrix containing normalized expression of 20,813 genes across 13,000 experiments is available for download at . Source code for GDS files pre-processing is available from the authors upon request.
Figures


References
Publication types
MeSH terms
Grants and funding
LinkOut - more resources
Full Text Sources
Research Materials
