. 2012 Jan 10;51(1):205-13.
doi: 10.1021/bi201293x. Epub 2011 Dec 23.

Regulation of urokinase expression at the posttranscription level by lung epithelial cells

Affiliations

Regulation of urokinase expression at the posttranscription level by lung epithelial cells

Shwetha K Shetty et al. Biochemistry. .

Abstract

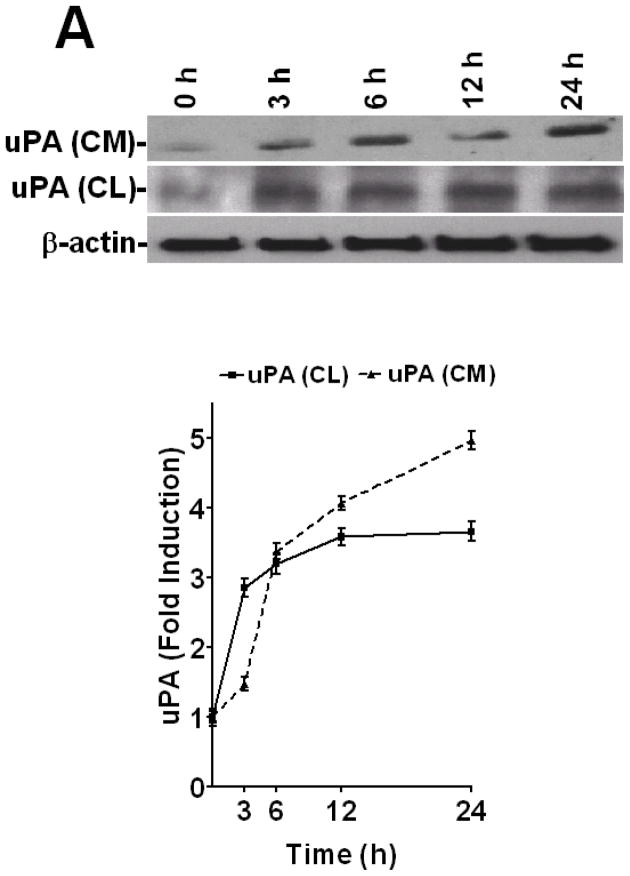
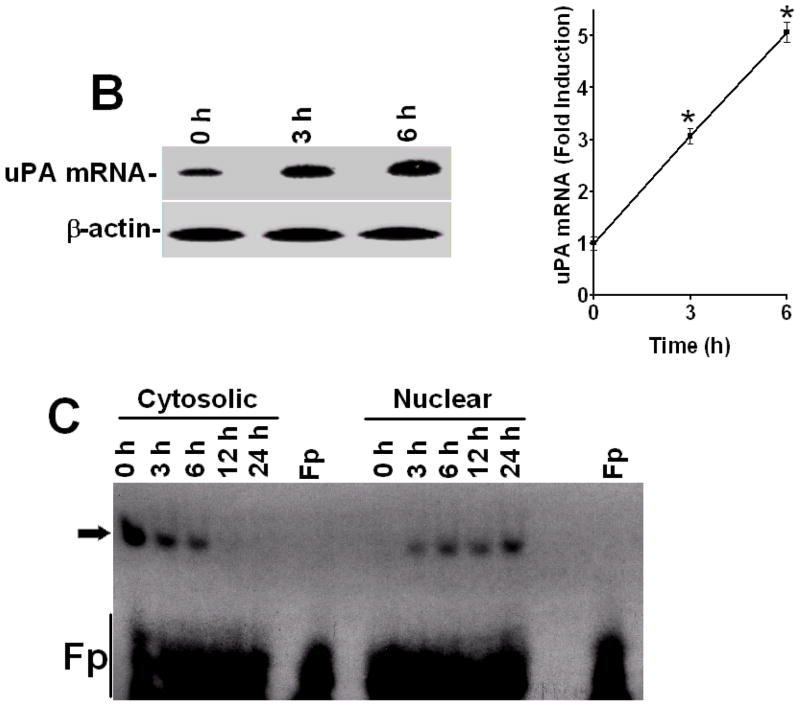
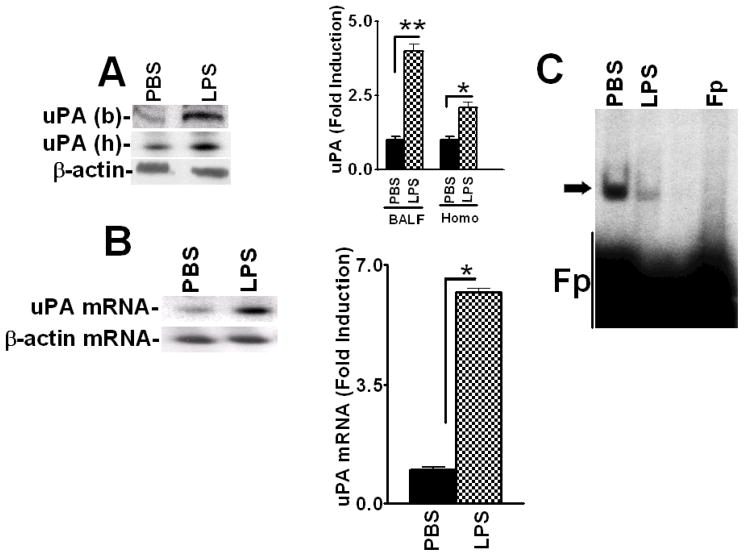
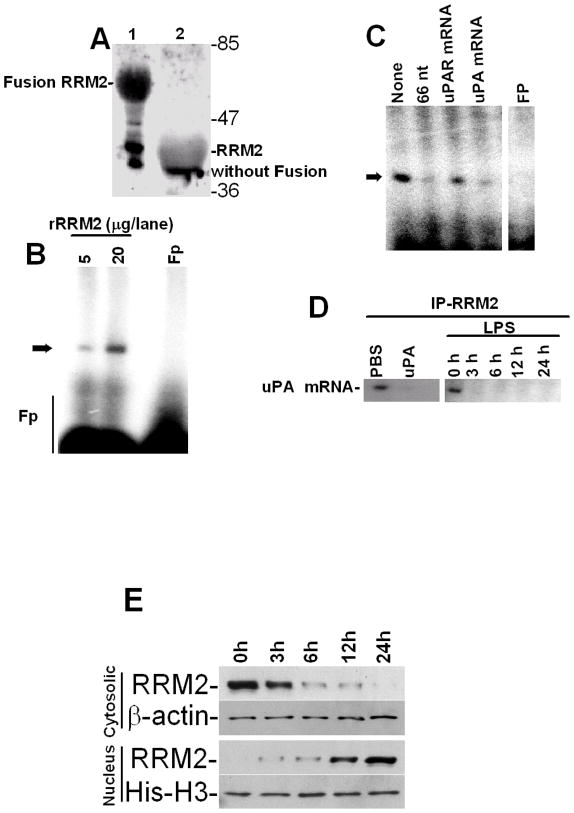
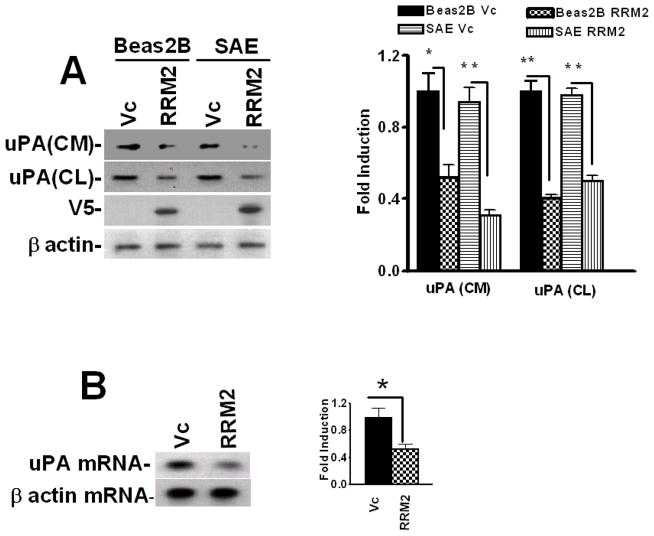
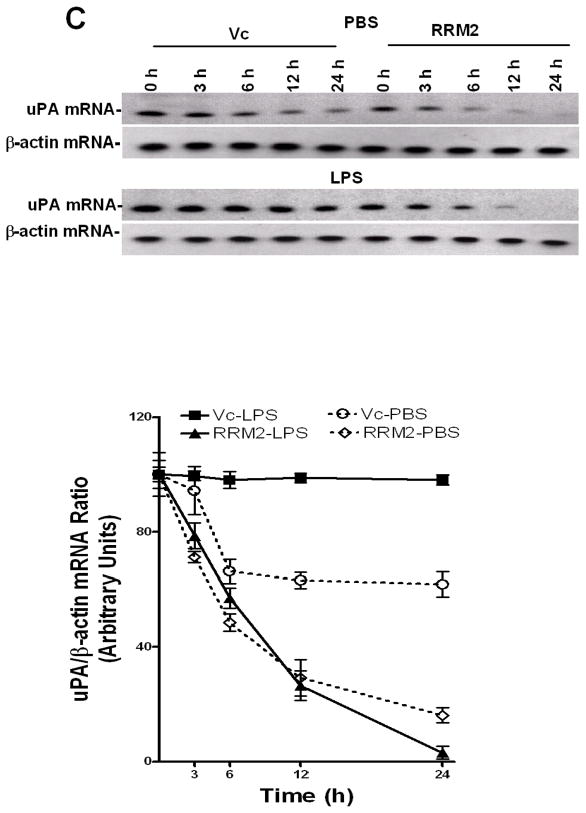
Urokinase-type plasminogen activator (uPA) is expressed by lung epithelial cells and regulates fibrin turnover and epithelial cell viability. PMA, LPS, and TNF-alpha, as well as uPA itself, induce uPA expression in lung epithelial cells. PMA, LPS, and TNF-alpha induce uPA expression through increased synthesis as well as stabilization of uPA mRNA, while uPA increases its own expression solely through uPA mRNA stabilization. The mechanism by which lung epithelial cells regulate uPA expression at the level of mRNA stability is unclear. To elucidate this process, we sought to characterize protein-uPA mRNA interactions that regulate uPA expression. Regulation of uPA at the level of mRNA stability involves the interaction of a ~40 kDa cytoplasmic-nuclear shuttling protein with a 66 nt uPA mRNA 3'UTR sequence. We purified the uPA mRNA 3'UTR binding protein and identified it as ribonucleotide reductase M2 (RRM2). We expressed recombinant RRM2 and confirmed its interaction with a specific 66 nt uPA 3'UTR sequence. Immunoprecipitation of cell lysates with anti-RRM2 antibody and RT-PCR for uPA mRNA confirmed that RRM2 binds to uPA mRNA. Treatment of Beas2B cells with uPA or LPS attenuated RRM2-endogenous uPA mRNA interactions, while overexpression of RRM2 inhibited uPA protein and mRNA expression through destabilization of uPA mRNA. LPS exposure of lung epithelial cells translocates RRM2 from the cytoplasm to the nucleus in a time-dependent manner, leading to stabilization of uPA mRNA. This newly recognized pathway could influence uPA expression and a broad range of uPA-dependent functions in lung epithelial cells in the context of lung inflammation and repair.


Figures

Figure 1
Figure 1
LPS induces time dependent uPA expression in lung epithelial cells. Beas2B cells cultured in 100 mm dishes were treated with LPS (20 μg/ml) for 0–24 h. A. The conditioned media (CM) and cytoplasmic extracts cell lysates (CL) of Beas2B cells were analyzed for uPA expression by Western blotting. The lower panel shows corresponding β-actin loading controls. The line graph shows fold induction relative to time 0 calculated from the densities of the individual bands from the three Western blots. In the case of CL, fold induction was calculated after normalization of the densities of each uPA bands with the corresponding densities of β-actin from three independent experiments. B. Total RNA isolated from Beas2B cells treated with LPS for 0, 3 and 6 h were analyzed for uPA and β-actin mRNA by RT-PCR using 32P-labeled dCTP. 32P-labeled PCR products were separated on a urea/PAGE, dried and autoradiographed. The fold induction relative to time 0 was calculated from the densities of uPA mRNA bands after normalization with that of β-actin mRNA is depicted in line graph. The * indicates that the mean values from three independent experiments are statistically significant (p<0.0001) compared to time 0. C. Cytosolic and nuclear extracts prepared from the Beas2B cells exposed to LPS for 0–24 h as described in Fig 1A were subjected to uPA mRNA 3′UTR binding by gel mobility shift assay using 32P-labeled 66 nt 3′UTR sequence as a probe. The reaction mixtures were incubated with RNaseT1 at 37° C for 30 minute followed by heparin treatment at room temperature for 10 min. RNaseT1-resistant uPA mRNABp and uPA mRNA complexes were separated by PAGE using TBE buffer, dried and autoradiographed. Fp = reaction mixture in cytoplasmic or nuclear extraction buffers without Beas2B cell proteins. Arrow indicates the uPA mRNA-uPA mRNABp complex.
Figure 1
Figure 1
LPS induces time dependent uPA expression in lung epithelial cells. Beas2B cells cultured in 100 mm dishes were treated with LPS (20 μg/ml) for 0–24 h. A. The conditioned media (CM) and cytoplasmic extracts cell lysates (CL) of Beas2B cells were analyzed for uPA expression by Western blotting. The lower panel shows corresponding β-actin loading controls. The line graph shows fold induction relative to time 0 calculated from the densities of the individual bands from the three Western blots. In the case of CL, fold induction was calculated after normalization of the densities of each uPA bands with the corresponding densities of β-actin from three independent experiments. B. Total RNA isolated from Beas2B cells treated with LPS for 0, 3 and 6 h were analyzed for uPA and β-actin mRNA by RT-PCR using 32P-labeled dCTP. 32P-labeled PCR products were separated on a urea/PAGE, dried and autoradiographed. The fold induction relative to time 0 was calculated from the densities of uPA mRNA bands after normalization with that of β-actin mRNA is depicted in line graph. The * indicates that the mean values from three independent experiments are statistically significant (p<0.0001) compared to time 0. C. Cytosolic and nuclear extracts prepared from the Beas2B cells exposed to LPS for 0–24 h as described in Fig 1A were subjected to uPA mRNA 3′UTR binding by gel mobility shift assay using 32P-labeled 66 nt 3′UTR sequence as a probe. The reaction mixtures were incubated with RNaseT1 at 37° C for 30 minute followed by heparin treatment at room temperature for 10 min. RNaseT1-resistant uPA mRNABp and uPA mRNA complexes were separated by PAGE using TBE buffer, dried and autoradiographed. Fp = reaction mixture in cytoplasmic or nuclear extraction buffers without Beas2B cell proteins. Arrow indicates the uPA mRNA-uPA mRNABp complex.
Figure 2
Figure 2
LPS induces expression of uPA in mouse lungs. C57BL-6 mice were treated with PBS or 25 μg of LPS intratracheally and sacrificed after 24 h. A. Brochoalveolar lavage fluid obtained at the time of sacrifice (b) and lung homogenates (h) were analyzed for uPA protein by Western blotting. Membrane containing proteins from the lung homogenates were stripped and tested for β-actin proteins to assess loading equality. Fold induction in uPA levels of LPS versus PBS treated control mice (presented as bar graph) were calculated based on the densities of bands integrated from four independent experiments. In the case of lung homogenates, densities of the uPA bands were normalized to the densities of the corresponding β-actin. The mean values are statistically (**p<0.001, *p<0.01) significant compared to those of PBS controls. B. Total RNA was isolated from lung tissues of mice exposed to PBS or LPS and analyzed for uPA mRNA expression as described in Fig 2B. Fold induction of the uPA/β-actin mRNA ratio presented as bar graphs are from four independent experiments. The * symbol indicates that the mean values are statistically (p<0.001) significant compared to PBS controls. C. Cytosolic extracts prepared from lung tissues of mice exposed to PBS or LPS, as described in Fig 2A, were subjected to uPA mRNA 3′UTR binding by gel mobility shift assays using 32P-labeled 66 nt uPA 3′UTR sequence as a probe. RNAseT1-resistant uPA mRNABp-uPA mRNA complexes were separated by PAGE and autoradiography. Fp = free probe. Arrow indicates uPA mRNA-uPA mRNABp complex.
Figure 3
Figure 3
Purification of the uPA mRNABp from lung epithelial cells. Cytosolic extracts from Beas2B cells were subjected to sequential ammonium sulfate fractionation. Protein fractions containing uPA mRNA binding activity were purified by passage through heparin sepharose, phenyl sepharose, Mono-Q and uPA mRNA affinity columns. Positive fractions were then subjected to gel mobility shift assay using 32P-labeled 66 nt uPA mRNA 3′UTR sequence as a probe. The RNA-protein complex was visualized by autoradiography, after which the bands were excised from the gel, pooled, electroeluted, and analyzed for uPA mRNA binding activity. A. Gel mobility shift assay of the uPA mRNA probe alone (lane 1), semipurified fractions from the mono-Q column (lane 2) or the uPA mRNABp fraction electroeluted from the gel (lane 3). B. Corresponding fractions from the mono-Q (lane 2) or uPA mRNABp fraction electroeluted from the gel (lane 3) were subjected to uPA mRNA 3′UTR binding using a 32P-labeled 66 nt uPA mRNA probe. Lane 1, uPA mRNA probe alone. These reaction mixtures were subjected to UV cross-linking after RNaseT1 and heparin digestion. Immobilized uPA mRNA-uPA mRNABp complexes were resolved on SDS-PAGE and autoradiographed. C. SDS-PAGE and silver staining of protein fractions from a Mono-Q column (lane 2), electroelution (lane 3) and Molecular weight standards (Lane 1). D. Protein fractions (lanes 2 and 3) from SDS-PAGE as described in Fig 3C were transferred to nitrocellulose and subjected to Northwestern assay using 32P-labeled uPA mRNA transcripts. E. Identification of RRM2 as an uPA mRNA 3′UTR binding protein. Protein fractions collected from the mono-Q column were separated on a SDS-PAGE and subjected to uPA mRNA 3′UTR binding by Northwestern assay using the 32P-labeled 66 nt uPA 3′UTR sequence as a probe. uPA mRNA 3′UTR binding activity in the fractions was confirmed by autoradiography. The same membrane was stripped and immunoblotted for RRM2 using anti-RRM2 antibody. F. Beas2B cells cultured in 100 mm dishes were treated with LPS (20 μg/ml) for 0–12 h as described in Fig 1A. The cells were detached and the cytoplasmic extracts were immunoprecipitated using anti-RRM2 antibody, separated on a SDS-PAGE and transferred to nitrocellulose membrane. The membrane was subjected to uPA mRNA 3′UTR binding by Northwestern assay using the 32P-labeled 66 nt 3′UTR sequence as a probe. The same membrane was stripped and developed by Western blotting using anti-RRM2 antibody. G. Beas2B cell lysates prepared after LPS treatment for 0–12 h as described in Fig 1A were separated on SDS-PAGE and subjected to Western blotting using anti-RRM2 antibody. The same membrane was stripped and developed with anti-β-actin antibody to assess equal loading. H. Cytoplasmic fractions of the lung homogenates of mice exposed PBS and LPS as described in Fig 2A were immunoprecipitated with anti-RRM2 antibody. The immune-complexes were separated on a SDS-PAGE, transferred to nitrocellulose membrane and subjected to Northwestern assay using 32P-labeled 66 nt uPA mRNA 3′UTR probe. The same membrane was stripped and Western blotted for RRM2 using anti-RRM2 antibody.
Figure 4
Figure 4
Expression of recombinant RRM2 (rRRM2) and determination of its uPA mRNA 3′UTR binding activity. A. Expression and purification of rRRM2 in a prokaryotic system. rRRM2 expressed in E. Coli was affinity purified using a glutathione-sepharose column. Purified rRRM2 with GST-fusion (lane 1) or without GST-fusion (lane 2) were separated on a SDS-PAGE and stained with Coomassie blue. B. Purified rRRM2 protein (5 and 20 μg) without GST fusion was subjected to uPA mRNA 3′UTR binding by gel mobility shift assay using 32P-labeled 66 nt uPA mRNA 3′UTR as a probe. Fp = 32P-labeled probe alone. C. Cold competition experiments. Purified rRRM2 were incubated with or without a 200-fold molar excess of unlabeled 66 nt uPA RRM2 binding sequence or full length uPAR or uPA 3′UTR sequences before incubation with 32P-labeled 66 nt uPA 3′UTR sequences. The reaction mixtures were subjected to RNAseT1 and heparin digestion and the uPA mRNA-RRM2 complexes were separated by PAGE and autoradiographed. Fp = reaction mixture containing all the reagents except rRRM2. Arrow indicates uPA mRNA-rRRM2 complex. D. Beas2B cells were treated with PBS or uPA for 24 h, or LPS for 0–24 h and the cell lysates were immunoprecipitated with anti-RRM2 antibody. uPA mRNA associated with RRM2 immune-complex was amplified by RT-PCR in the presence of 32P-dCTP using uPA specific primers. The 32P-labeled PCR products were separated on a urea/polyacrylamide gel, dried and autoradiographed. E. The cytoplasmic and nuclear extracts prepared from Beas2B cells treated with LPS for 0–24 h as described in Fig 1C were subjected to Western blotting using anti-RRM2 antibody. The nitrocellulose membranes containing proteins from cytoplasmic and nuclear extracts were stripped and reprobed with anti-β-actin and anti-histone H3 antibodies respectively to assess similar loading. Experiments were repeated twice with identical results.
Figure 5
Figure 5
Inhibition of uPA expression by RRM2 in lung epithelial cells. Beas2B and primary SAE cells were transfected with vector pcDNA3.1 alone (Vc) or RRM2 cDNA in pcDNA3.1. A. The conditioned media (CM) and cell lysates (CL) were collected and analyzed for uPA expression by Western blotting. The membrane containing proteins from the CL were stripped and immunoblotted using anti-V5 and anti-β-actin antibody to assess expression of the fusion protein and equal loading, respectively. Experiments were repeated at least three times. The bar graph represents fold changes in uPA protein level in CM and CL. In the case of CL, uPA fold induction was calculated after normalization with the densities of β-actin proteins. The changes in the expression levels between cells transfected with vector DNA and RRM2 cDNA are statistically significant (**p<0.001 and *p<0.01). B. Total RNA isolated from the Beas2B cells treated with vector DNA or cDNA coding for RRM2 were analyzed for uPA mRNA by RT-PCR using 32P-labeled dCTP in the reaction mixture. Amplified PCR products were separated on a urea/polyacrylamide gel using TBE buffer, dried and autoradiographed. Fold induction of mRNA ratio (uPA/β-actin density) presented as bar graph from three experiments. The * symbol indicates that the mean values are statistically (p<0.001) significant when compared between Vc and RRM2. C. Beas2B cells expressing pcDNA3.1 or RRM2 cDNA were treated with PBS or LPS for 12 h to induce maximum uPA mRNA expression. These cells were then exposed to DRB (20 μg/ml) to inhibit ongoing transcription. Total RNA was isolated from these cells 0–24 h after treatment with DRB and was analyzed for uPA mRNA by RT-PCR in the presence of 32P-dCTP. The PCR products were separated on a urea/polyacrylamide gel and autoradiographed. The line graph represents the percentage of mRNA decay relative to Time 0 (designated 100%), calculated from the mean values obtained by integrating the densities of individual bands from three independent experiments.
Figure 5
Figure 5
Inhibition of uPA expression by RRM2 in lung epithelial cells. Beas2B and primary SAE cells were transfected with vector pcDNA3.1 alone (Vc) or RRM2 cDNA in pcDNA3.1. A. The conditioned media (CM) and cell lysates (CL) were collected and analyzed for uPA expression by Western blotting. The membrane containing proteins from the CL were stripped and immunoblotted using anti-V5 and anti-β-actin antibody to assess expression of the fusion protein and equal loading, respectively. Experiments were repeated at least three times. The bar graph represents fold changes in uPA protein level in CM and CL. In the case of CL, uPA fold induction was calculated after normalization with the densities of β-actin proteins. The changes in the expression levels between cells transfected with vector DNA and RRM2 cDNA are statistically significant (**p<0.001 and *p<0.01). B. Total RNA isolated from the Beas2B cells treated with vector DNA or cDNA coding for RRM2 were analyzed for uPA mRNA by RT-PCR using 32P-labeled dCTP in the reaction mixture. Amplified PCR products were separated on a urea/polyacrylamide gel using TBE buffer, dried and autoradiographed. Fold induction of mRNA ratio (uPA/β-actin density) presented as bar graph from three experiments. The * symbol indicates that the mean values are statistically (p<0.001) significant when compared between Vc and RRM2. C. Beas2B cells expressing pcDNA3.1 or RRM2 cDNA were treated with PBS or LPS for 12 h to induce maximum uPA mRNA expression. These cells were then exposed to DRB (20 μg/ml) to inhibit ongoing transcription. Total RNA was isolated from these cells 0–24 h after treatment with DRB and was analyzed for uPA mRNA by RT-PCR in the presence of 32P-dCTP. The PCR products were separated on a urea/polyacrylamide gel and autoradiographed. The line graph represents the percentage of mRNA decay relative to Time 0 (designated 100%), calculated from the mean values obtained by integrating the densities of individual bands from three independent experiments.
Figure 6
Figure 6
Role of p53 in RRM2 expression and RRM2-uPA 3′UTR mRNA binding. A. cytosolic extracts of naïve p53-deficient (H1299) cells or H1299 cells transfected with vector pcDNA3.1 alone (Vc) or p53 cDNA in pcDNA3.1 were analyzed for RRM2 expression by Western blotting using anti-RRM2 antibody. The same membrane was stripped and immunoblotted for β-actin to assess equal loading. B. Cytoplasmic extracts of H1299 cells or H1299 cells transfected with vector pcDNA 3.1 (Vc) or p53 cDNA in pcDNA3.1 as described in Fig 6A were immunoprecipitated with anti-RRM2 antibody and immunoblotted for p53 (upper panel). The same membrane was stripped and developed for RRM2 (lower panel) by Western blotting. C. Naïve H1299 cells transfected with or without pcDNA3.1 alone (Vc) or p53 cDNA in pcDNA3.1 were treated with PBS or LPS (20 μg/ml) or ATF of uPA (1 μg/ml) for 24 h at 37°C. The conditioned media were analyzed for uPA expression by Western blotting using anti-uPA antibody. D. Naïve H1299 cells or H1299 cells transfected with p53 cDNA in pcDNA 3.1 or pcDNA 3.1 alone (Vc) were immunoprecipitated with anti-p53 antibody and immunoblotted for RRM2. H1299 cells transfected with p53 cDNA in pcDNA3.1 were treated with PBS, ATF or LPS as described in Fig 6C and the cytosolic extracts were immunoprecipitated with p53 and developed for RRM2 by Western blotting. H1299 cell lysate was used as a positive control and immunoprecipitation without H1299 cell lysates (mouse IgG) was as a negative control for Western blotting.

References

    1. Dumler I, Petri T, Schleuning WD. Interaction of urokinase-type plasminogenactivator (u-PA) with its cellular receptor (u-PAR) induces phosphorylation on tyrosine of a 38 kda protein. FEBS Lett. 1993;322:37–40. - PubMed
    1. Shetty S, Pendurthi UR, Halady PK, Azghani AO, Idell S. Urokinase induces its own expression in Beas2b lung epithelial cells. Am J Physiol Lung Cell Mol Physiol. 2002;283:L319–L328. - PubMed
    1. Koopman JL, Slomp J, de Bart AC, Quax PH, Verheijen JH. Effects of urokinase on melanoma cells are independent of high affinity binding to the urokinase receptor. J Biol Chem. 1998;273:33267–33272. - PubMed
    1. Koshelnick Y, Ehart M, Hufnagl P, Heinrich PC, Binder BR. Urokinase receptor is associated with the components of the JAK1/STAT1 signaling pathway and leads to activation of this pathway upon receptor clustering in the human kidney epithelial tumor cell line tcl-598. J Biol Chem. 1997;272:28563–28567. - PubMed
    1. Bhat GJ, Gunaje JJ, Idell S. Urokinase-type plasminogen activator induces tyrosine phosphorylation of a 78-kDa protein in H-157 cells. Am J Physiol. 1999;277:L301–L309. - PubMed

Publication types

MeSH terms

Substances