

Pgp-mediated interaction between (R)-[11C]verapamil and tariquidar at the human blood-brain barrier: a comparison with rat data
- PMID: 22166851
- PMCID: PMC3685270
- DOI: 10.1038/clpt.2011.217
Pgp-mediated interaction between (R)-[11C]verapamil and tariquidar at the human blood-brain barrier: a comparison with rat data
Abstract
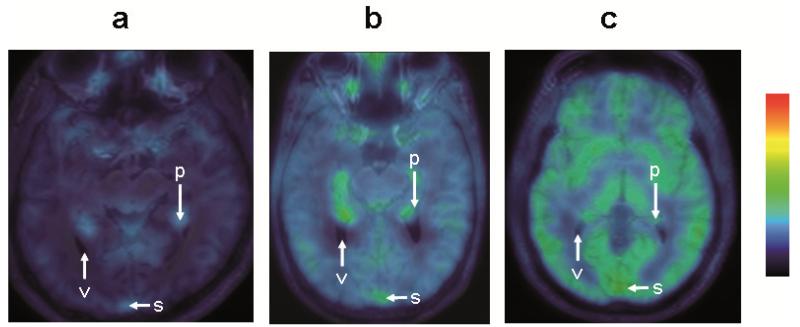
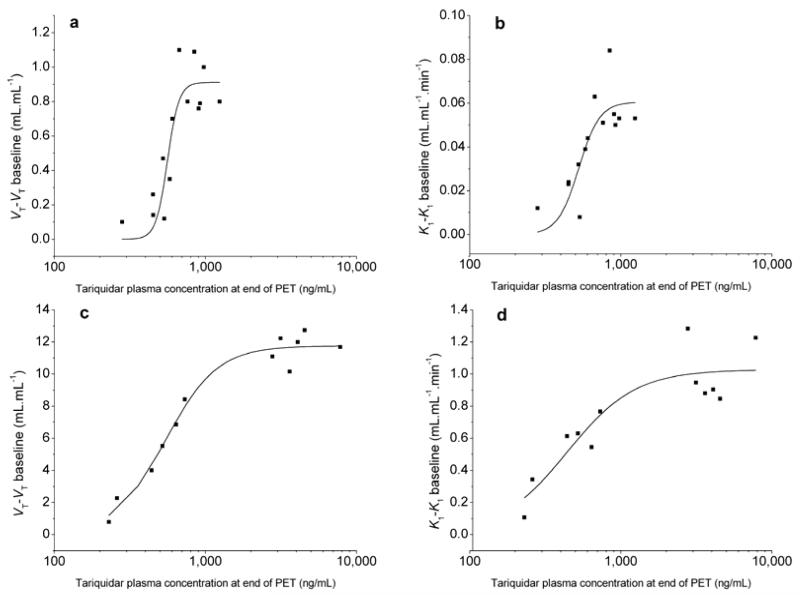
Using positron emission tomography (PET) imaging we assessed, in vivo, the interaction between a microdose of (R)-[(11)C]verapamil (a P-glycoprotein (Pgp) substrate) and escalating doses of the Pgp inhibitor tariquidar (3, 4, 6, and 8 mg/kg) at the blood-brain barrier (BBB) in healthy human subjects. We compared the dose-response relationship of tariquidar in humans with data obtained in rats using a similar methodology. Tariquidar was equipotent in humans and rats in its effect of increasing (R)-[(11)C]verapamil brain uptake (expressed as whole-brain volume of distribution (V(T))), with very similar half-maximum-effect concentrations. Both in humans and in rats, brain V(T) approached plateau levels at plasma tariquidar concentrations >1,000 ng/ml. However, Pgp inhibition in humans led to only a 2.7-fold increase in brain V(T) relative to baseline scans (before administration of tariquidar) as compared with 11.0-fold in rats. The results of this translational study add to the accumulating evidence that there are marked species-dependent differences in Pgp expression and functionality at the BBB.
Figures


Similar articles
-
Tariquidar-induced P-glycoprotein inhibition at the rat blood-brain barrier studied with (R)-11C-verapamil and PET.J Nucl Med. 2008 Aug;49(8):1328-35. doi: 10.2967/jnumed.108.051235. Epub 2008 Jul 16. J Nucl Med. 2008. PMID: 18632828 Free PMC article.
-
Dose-response assessment of tariquidar and elacridar and regional quantification of P-glycoprotein inhibition at the rat blood-brain barrier using (R)-[(11)C]verapamil PET.Eur J Nucl Med Mol Imaging. 2010 May;37(5):942-53. doi: 10.1007/s00259-009-1332-5. Epub 2009 Dec 17. Eur J Nucl Med Mol Imaging. 2010. PMID: 20016890 Free PMC article.
-
Assessment of cerebral P-glycoprotein expression and function with PET by combined [11C]inhibitor and [11C]substrate scans in rats.Nucl Med Biol. 2013 Aug;40(6):755-63. doi: 10.1016/j.nucmedbio.2013.05.005. Epub 2013 Jun 15. Nucl Med Biol. 2013. PMID: 23774004
-
Radioligands targeting P-glycoprotein and other drug efflux proteins at the blood-brain barrier.J Labelled Comp Radiopharm. 2013 Mar-Apr;56(3-4):68-77. doi: 10.1002/jlcr.2993. J Labelled Comp Radiopharm. 2013. PMID: 24285312 Review.
-
P-glycoprotein imaging in temporal lobe epilepsy: in vivo PET experiments with the Pgp substrate [11C]-verapamil.Epilepsia. 2012 Nov;53 Suppl 6:60-3. doi: 10.1111/j.1528-1167.2012.03704.x. Epilepsia. 2012. PMID: 23134497 Review.
Cited by
-
Induction of P-glycoprotein by antiretroviral drugs in human brain microvessel endothelial cells.Antimicrob Agents Chemother. 2013 Sep;57(9):4481-8. doi: 10.1128/AAC.00486-13. Epub 2013 Jul 8. Antimicrob Agents Chemother. 2013. PMID: 23836171 Free PMC article.
-
Modeling cyclosporine A inhibition of the distribution of a P-glycoprotein PET ligand, 11C-verapamil, into the maternal brain and fetal liver of the pregnant nonhuman primate: impact of tissue blood flow and site of inhibition.J Nucl Med. 2013 Mar;54(3):437-46. doi: 10.2967/jnumed.112.111732. Epub 2013 Jan 28. J Nucl Med. 2013. PMID: 23359659 Free PMC article.
-
Comparative vulnerability of PET radioligands to partial inhibition of P-glycoprotein at the blood-brain barrier: A criterion of choice?J Cereb Blood Flow Metab. 2022 Jan;42(1):175-185. doi: 10.1177/0271678X211045444. Epub 2021 Sep 9. J Cereb Blood Flow Metab. 2022. PMID: 34496661 Free PMC article.
-
Novel Intrinsic Mechanisms of Active Drug Extrusion at the Blood-Brain Barrier: Potential Targets for Enhancing Drug Delivery to the Brain?Pharmaceutics. 2020 Oct 14;12(10):966. doi: 10.3390/pharmaceutics12100966. Pharmaceutics. 2020. PMID: 33066604 Free PMC article. Review.
-
Pharmacokinetics of single ascending doses of the P-glycoprotein inhibitor tariquidar in healthy subjects.Pharmacology. 2013;91(1-2):12-9. doi: 10.1159/000343243. Epub 2012 Nov 7. Pharmacology. 2013. PMID: 23146816 Free PMC article. Clinical Trial.
References
-
- Chinn LW, Kroetz DL. ABCB1 pharmacogenetics: progress, pitfalls, and promise. Clin. Pharmacol. Ther. 2007;81:265–269. - PubMed
-
- Löscher W, Potschka H. Role of drug efflux transporters in the brain for drug disposition and treatment of brain diseases. Prog. Neurobiol. 2005;76:22–76. - PubMed
-
- Hammarlund-Udenaes M, Bredberg U, Friden M. Methodologies to assess brain drug delivery in lead optimization. Curr. Top. Med. Chem. 2009;9:148–162. - PubMed
-
- Uchida Y, et al. Quantitative targeted absolute proteomics of human blood-brain barrier transporters and receptors. J. Neurochem. 2011;117:333–345. - PubMed
Publication types
MeSH terms
Substances
Grants and funding
LinkOut - more resources
Full Text Sources
Miscellaneous
