. 2012 Feb;158(2):666-78.
doi: 10.1104/pp.111.189258. Epub 2011 Dec 13.

Biosynthesis of proanthocyanidins in white clover flowers: cross talk within the flavonoid pathway

Affiliations

Biosynthesis of proanthocyanidins in white clover flowers: cross talk within the flavonoid pathway

Shamila Weerakoon Abeynayake et al. Plant Physiol. 2012 Feb.

Abstract

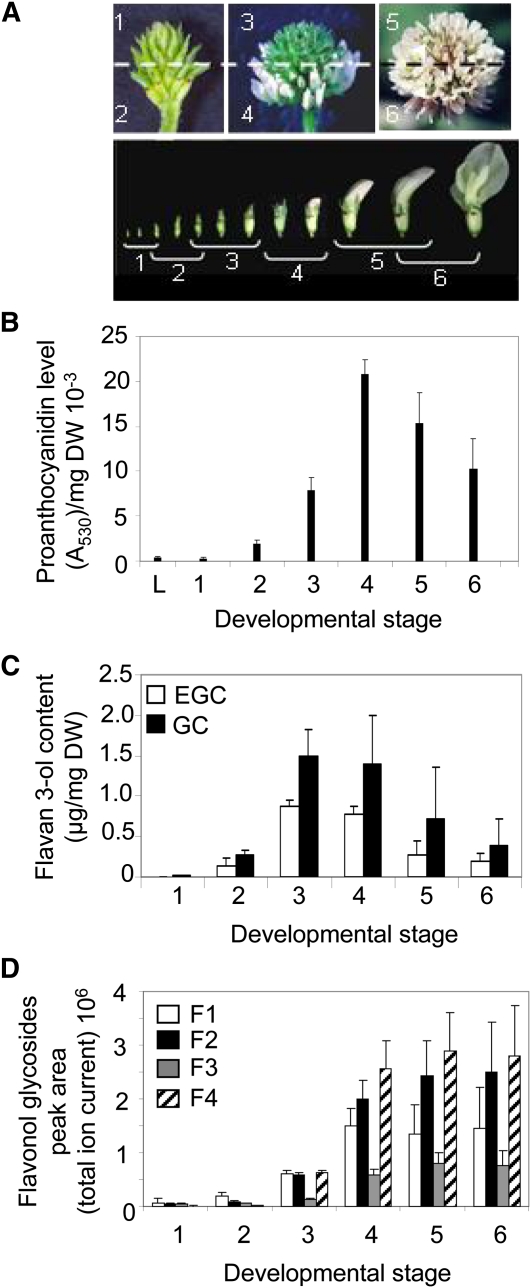
Proanthocyanidins and anthocyanins are produced by closely related branches of the flavonoid pathway and utilize the same metabolic intermediates. Previous studies have shown a flexible mechanism of flux diversion at the branch-point between the anthocyanin and proanthocyanidin pathways, but the molecular basis for this mechanism is poorly understood. Floral tissues in white clover plants (Trifolium repens) produce both proanthocyanidins and anthocyanins. This makes white clover amenable to studies of proanthocyanidin and anthocyanin biosynthesis and possible interactions within the flavonoid pathway. Results of this study show that the anthocyanin and proanthocyanidin pathways are spatially colocalized within epidermal cells of petals and temporally overlap in partially open flowers. A correlation between spatiotemporal patterns of anthocyanin and proanthocyanidin biosynthesis with expression profiles of putative flavonoid-related genes indicates that these pathways may recruit different isoforms of flavonoid biosynthetic enzymes. Furthermore, in transgenic white clover plants with down-regulated expression of the anthocyanidin reductase gene, levels of flavan 3-ols, anthocyanins, and flavonol glycosides and the expression levels of a range of genes encoding putative flavonoid biosynthetic enzymes and transcription factors were altered. This is consistent with the hypothesis that flux through the flavonoid pathway may be at least partially regulated by the availability of intermediates.


Figures

Figure 1.
Figure 1.
Accumulation of proanthocyanidins and anthocyanins in white clover flowers and leaves. A and B, Immature inflorescences. C and D, Inflorescences in which 50% of flowers were open. E, Flowers at different stages of maturity, corresponding to developmental stages 1 to 4 in Figure 2A. F and G, Mature inflorescences. H, Sepals of a mature flower showing trichomes. I, Asymmetrical corolla of a mature flower containing standard (1), wing (2), and keel (3) petals. J, Transverse section through an immature standard petal in which proanthocyanidins accumulated only on the abaxial side. K, Transverse section through a mature standard petal showing the accumulation of proanthocyanidins on both the abaxial and adaxial sides. L, Fused stamens. M, Carpel. N, A single multicellular trichome. O, Transverse section through an immature leaf. P, Longitudinal section of a petiole. Q to W, Visualization of anthocyanins in flowers and leaves. Q, Immature flower. R, Whole sepal. S, Magnified sector of pigmented epidermal cells on the abaxial surface of a sepal. T, Transverse section through the pigmented cells shown in S. U, Transverse section through a mature petal. V, Anthocyanin-rich sector on the adaxial surface of a leaf. W, Transverse section through an anthocyanin-rich sector of a leaf. In B, D, E, G, H, and J to P, samples were stained using DMACA to visualize proanthocyanidins. ab, Abaxial; ad, adaxial; S, sepals. Bars = 1 mm (A–I, L, M, P–R, and V), 50 μm (J, K, O, S–U, and W), and 10 μm (N).
Figure 2.
Figure 2.
Analysis of proanthocyanidin, flavan 3-ol, and flavonol glycoside levels in white clover inflorescences containing flowers at six stages of flower development. A, Appearance of white clover inflorescences and flowers at six stages of flower development. B, Level of proanthocyanidins (A530 mg−1 dry weight [DW] × 10−3). C, Level and composition of flavan 3-ols (μg mg−1 dry weight). D, Level and composition of flavonol glycosides (total ion current × 106). L, Leaves; F1, myricetin glycoside, m/z 479; F2, quercetin glycoside, m/z 463; F3, kaempferol glycoside, m/z 447; F4, quercetin acetyl-glycoside, m/z 505. Chemical formulae of the flavonoids are shown in Supplemental Table S1. Data shown are means of three biological replicates. Error bars denote se.
Figure 3.
Figure 3.
Phenotypes of flowers from TrANRhp transgenic white clover lines. A to C, Fifty percent open inflorescences of TrANRhp lines showing white-flowered (W10), pink-flowered (P8), and red-flowered (R14) phenotypes, respectively. D, Inflorescence of the TrANRhp-R14 line with flowers at developmental stages 5 and 6. E, Individual flowers of the TrANRhp-R14 line at stages 3 to 6 (left to right). F, Immature inflorescences at stage 3 of a wild-type plant (left) and the TrANRhp-R14 line (right). G, Standard petals of a wild-type plant (top) and the TrANRhp-R14 line (bottom) at stage 3. H, Keel (left) and wing (right) petals of the TrANRhp-R14 line at stage 3. I, Petal epidermal cells of the R14 line at high magnification. J, Protoplasts isolated from petals of the TrANRhp-R14 line and wild-type plants (inset). K, Cross-section of a flower from the TrANRhp-R14 line at stage 3 showing the accumulation of anthocyanins on abaxial and adaxial epidermal cells of standard petal (s), abaxial epidermal cells of carpels (c), and stamen filaments (sf). L, Cross-section of a carpel from a flower at developmental stage 4 from a wild-type plant after staining for proanthocyanidins with DMACA. M, Cross-section of an unstained carpel from the TrANRhp-R14 line (stage 4). N and O, Anther filaments of wild-type plants after staining with DMACA (stage 3) at low and high magnification, respectively. P and Q, Anther filaments (unstained; stage 3) of the TrANRhp-R14 line at low and high magnification, respectively. R, Carpel of a wild-type plant stained with DMACA (stage 3). S and T, Carpel of the TrANRhp-R14 line seen at low and high magnification, respectively. Bars = 2 mm (A–H), 50 μm (I, J, and T), 0.5 mm (K–N, P, R, and S), and 70 μm (O and Q).
Figure 4.
Figure 4.
Analysis of TrANR transcript levels in TrANRhp white clover lines. Normalized relative TrANR transcript levels were determined in 50% open inflorescences of the indicated lines by quantitative real-time RT-PCR. R lines, Transgenic lines with red petals; P lines, transgenic lines with pink petals; W lines, transgenic lines with white petals; WT, wild-type cv Mink plants. Real-time RT-PCR data were expressed as means of three technical replicates derived from a single pooled sample of three flowers from the same stage of development. Expression values were normalized relative to the endogenous EF1α control gene. Error bars, denoting se, are too small to be seen in bars representing transgenic lines.
Figure 5.
Figure 5.
Analysis of flavonoid levels in TrANRhp white clover lines. Level and composition of flavonoid pathway products in 50% open inflorescences are shown. A, Level of proanthocyanidins (A530 mg−1 dry weight [DW] × 10−3). B, Level and composition of flavan 3-ols (μg mg−1 dry weight). C, Level and composition of anthocyanins (A500–550 mg−1 dry weight × 105). D, Level and composition of flavonol glycosides (total ion current × 106). A1, Delphinidin 3-sambubioside; A2, cyanidin 3-sambubioside; F1, myricetin glycoside, m/z 479; F2, quercetin glycoside, m/z 463; F3, kaempferol glycoside, m/z 447; F4, quercetin acetyl-glycoside, m/z 505; R lines, transgenic lines with red petals; P lines, transgenic lines with pink petals; WT, wild-type cv Mink. Chemical formulae of flavonoids are shown in Supplemental Table S1. Data are means of three technical replicates derived from a single pooled sample of three flowers from the same stage of development. Error bars denote se.
Figure 6.
Figure 6.
A model for flavonoid biosynthesis in white clover flowers based on biochemical and transcriptomic analyses of TrANRhp transgenic white clover lines in which the endogenous ANR gene was targeted for silencing. Specific compounds are listed in lowercase letters. Classes of compounds are listed in uppercase letters. Enzymes are shown as open boxes. Compounds and genes encoding enzymes marked in red were up-regulated in red-flowered transgenic lines, relative to wild type cv Mink white clover plants. Compounds and genes encoding enzymes marked in blue were down-regulated in the transgenic lines. Full names of enzymes and transcriptomic data, obtained from a microarray experiment in which inflorescences at the 50% open stage of development were harvested from three independent transgenic lines and three wild-type white clover plants of different genotypes and analyzed using a custom-made 12K CombiMatrix oligonucleotide array, are shown in Supplemental Tables S4 and S5.

References

    1. Abrahams S, Lee E, Walker AR, Tanner GJ, Larkin PJ, Ashton AR. (2003) The Arabidopsis TDS4 gene encodes leucoanthocyanidin dioxygenase (LDOX) and is essential for proanthocyanidin synthesis and vacuole development. Plant J 35: 624–636 - PubMed
    1. Abrahams S, Tanner GJ, Larkin PJ, Ashton AR. (2002) Identification and biochemical characterization of mutants in the proanthocyanidin pathway in Arabidopsis. Plant Physiol 130: 561–576 - PMC - PubMed
    1. Almeida JR, D’Amico E, Preuss A, Carbone F, de Vos CH, Deiml B, Mourgues F, Perrotta G, Fischer TC, Bovy AG, et al. (2007) Characterization of major enzymes and genes involved in flavonoid and proanthocyanidin biosynthesis during fruit development in strawberry (Fragaria × ananassa). Arch Biochem Biophys 465: 61–71 - PubMed
    1. Baudry A, Heim MA, Dubreucq B, Caboche M, Weisshaar B, Lepiniec L. (2004) TT2, TT8, and TTG1 synergistically specify the expression of BANYULS and proanthocyanidin biosynthesis in Arabidopsis thaliana. Plant J 39: 366–380 - PubMed
    1. Beggs CJ, Kuhn K, Bocker R, Wellmann E. (1987) Phytochrome-induced flavonoid biosynthesis in mustard (Sinapis alba L.) cotyledons: enzymic control and differential regulation of anthocyanin and quercetin formation. Planta 172: 121–126 - PubMed

Publication types

Associated data

LinkOut - more resources