. 2012 Mar;32(3):570-84.
doi: 10.1038/jcbfm.2011.182. Epub 2011 Dec 14.

NMDA-dependent mechanisms only affect the BOLD response in the rat dentate gyrus by modifying local signal processing

Affiliations

NMDA-dependent mechanisms only affect the BOLD response in the rat dentate gyrus by modifying local signal processing

Regina Tiede et al. J Cereb Blood Flow Metab. 2012 Mar.

Abstract

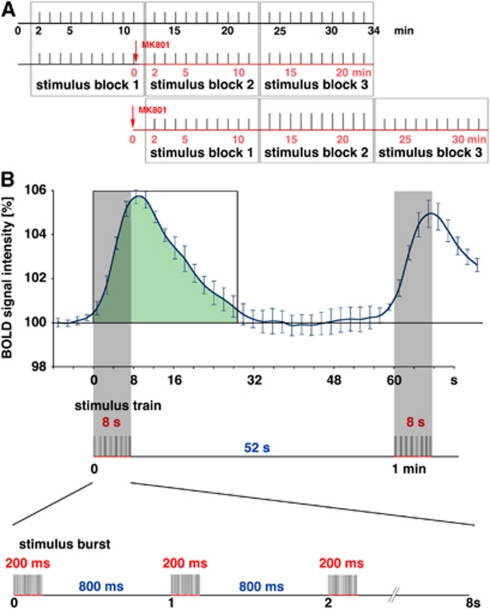
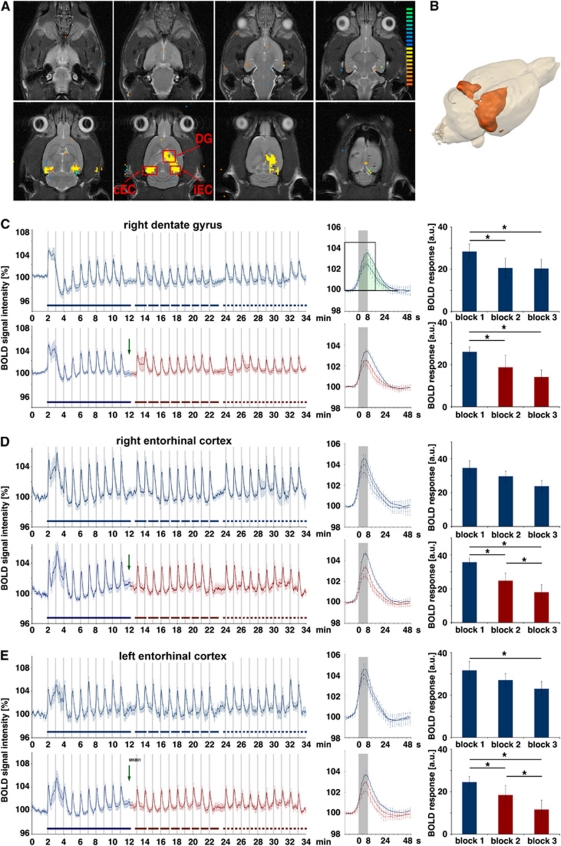
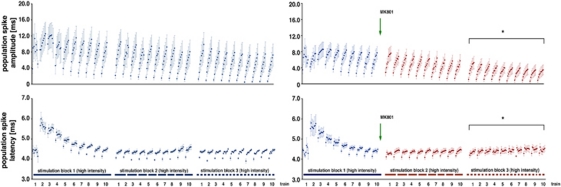
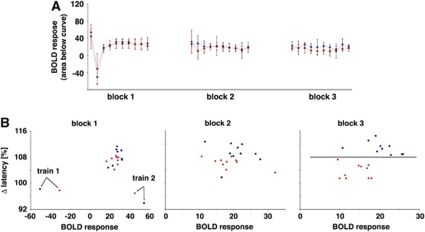
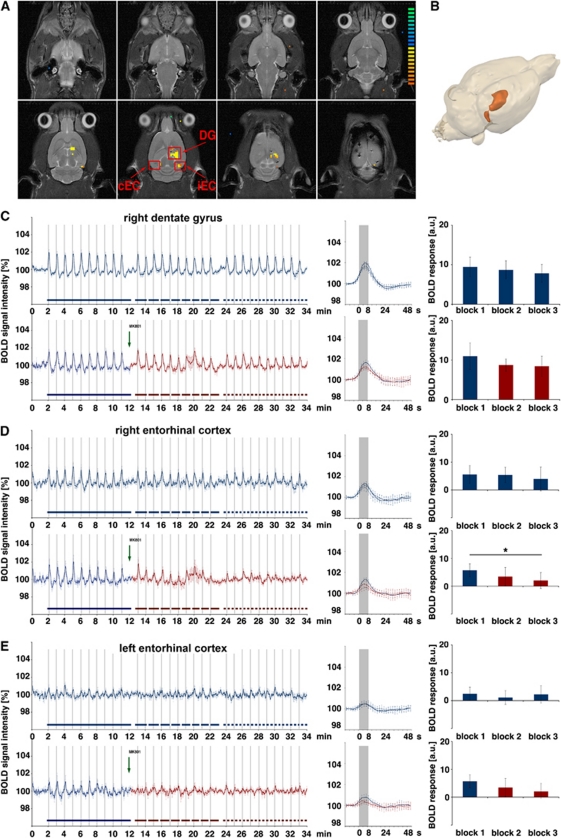
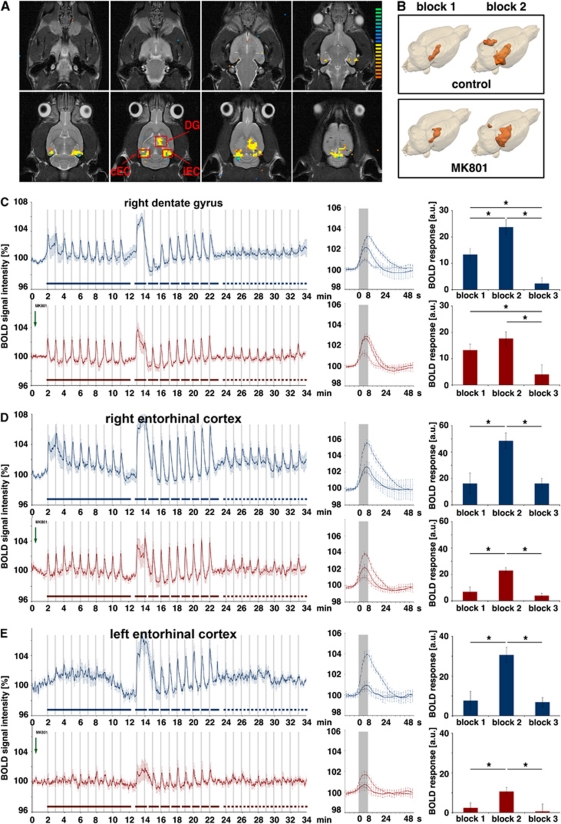
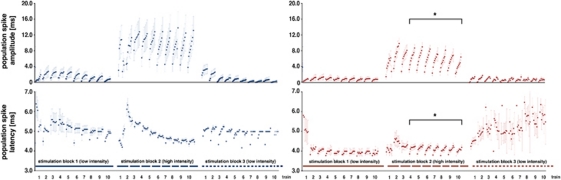
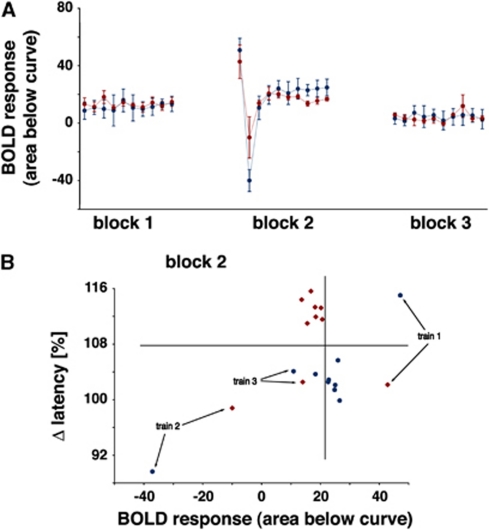
The role of N-methyl-D-aspartate (NMDA) receptor-mediated mechanisms in the formation of a blood oxygen level-dependent (BOLD) response was studied using electrical stimulation of the right perforant pathway. Stimulation of this fiber bundle triggered BOLD responses in the right hippocampal formation and in the left entorhinal cortex. The perforant pathway projects to and activates the dentate gyrus monosynaptically, activation in the contralateral entorhinal cortex is multisynaptic and requires forwarding and processing of signals. Application of the NMDA receptor antagonist MK801 during stimulation had no effect on BOLD responses in the right dentate gyrus, but reduced the BOLD responses in the left entorhinal cortex. In contrast, application of MK801 before the first stimulation train reduced the BOLD response in both regions. Electrophysiological recordings revealed that the initial stimulation trains changed the local processing of the incoming signals in the dentate gyrus. This altered electrophysiological response was not further changed by a subsequent application of MK801, which is in agreement with an unchanged BOLD response. When MK801 was present during the first stimulation train, a dissimilar electrophysiological response pattern was observed and corresponds to an altered BOLD response, indicating that NMDA-dependent mechanisms indirectly affect the BOLD response, mainly via modifying local signal processing and subsequent propagation.


Figures

Figure 1
Figure 1
Schematic overview of the stimulation protocol. (A) The perforant pathway was stimulated with 3 consecutive stimulation blocks containing 10 identical stimulation trains (indicated as gray bars). The N-methyl--aspartate (NMDA) receptor inhibitor MK801 was applied either immediately after the first stimulation block (middle graph) or immediately before the stimulation protocol started (lower graph). The effective time of MK801 is indicated by the red time scale. An effect of MK801 is assumed after a time delay of 8 to 12 minutes (Gsell et al, 2006), thus during the third block when the inhibitor is applied during the stimulation protocol or during the second block when the inhibitor was applied before the stimulation started. (B) Temporal relation between measured blood oxygen level-dependent (BOLD) response and electrical stimulation of the perforant pathway. Every minute one stimulation train was applied that lasted 8 seconds, which corresponds to four frames in the functional magnetic resonance imaging (fMRI) (indicated by the gray bar). One stimulation train consists of 8 bursts of 20 stimuli at 100 Hz. Thus, one burst lasts 200 ms followed by 800 ms rest. For quantification of a BOLD response, the area below the hemodynamic response curve was calculated starting with the stimulus onset end ending 28 seconds later (green area). The colour reproduction of this figure is available on online version.
Figure 2
Figure 2
Development of the blood oxygen level-dependent (BOLD) response during application of MK801. The perforant pathway was stimulated with 3 consecutive stimulation blocks containing 10 high intensity stimulation trains. In the test group, MK801 was applied after the first stimulation block (green arrow) whereas the control group remained untreated. (A) BOLD response pattern caused by the stimulation and the measured regions: DG, ipsilateral (right) dentate gyrus; iEC, ipsilateral entorhinal cortex; cEC, contralateral (left) entorhinal cortex. (B) 3D visualization of significant BOLD responses induced by repetitive high intensity stimulation trains. (C) Averaged BOLD time series in the dentate gyrus during control (upper graph) and test conditions (lower graph). The presence of MK801 is indicated by the red color. The averaged BOLD responses measured during each block are depicted in the middle part. The solid lines represent the averaged BOLD responses of the first block (only the last six trains were considered), the dashed line the BOLD responses of the second block, and the dotted line the BOLD responses of the third block. Comparing the BOLD time series revealed no difference whether MK801 was added or not. The amount of BOLD responses was calculated by measuring the area below each BOLD response in the entire signal time course between stimulus onset and 14 frames later (for the first stimulation block indicated by the green area in the black rectangle in the middle part). Both under control and test condition, the BOLD responses in the second and third block stimulation blocks were significantly decreased; thus, MK801 had no significant effect on the BOLD response in the dentate gyrus. (D) BOLD time series measured simultaneously in the ipsilateral entorhinal cortex. In this region, the magnitude of the BOLD response decreased significantly in the second and third blocks after MK801 was added. (E) The development of the simultaneous BOLD response in the contralateral entorhinal cortex. In this region, the magnitude of the BOLD response was also significantly reduced in the second and third stimulation blocks after MK801 was injected. In contrast, in the control group only a significant difference was found between the first and last stimulation blocks. Therefore, presence of MK801 only reduced the elicited BOLD signals in the left and right entorhinal cortices (control group: n=6, test group: n=6; *P<0.05, Wilcoxon's test).
Figure 3
Figure 3
Development of the population spike amplitude and latency in the right dentate gyrus during application of MK801. Electrophysiological recordings were performed during acquisition of the functional magnetic resonance imaging (fMRI) data; thus, these data correspond to the blood oxygen level-dependent (BOLD) responses shown in Figure 2C. During the first stimulation block, the population spike latency varied considerably; after an initial increase during the second train they decrease to reach a stable value at the end of the first block. During the next two stimulation blocks, the average latencies remained stable and no effect on the average latency was observed when MK801 was added after the first stimulation block (application indicated by the green arrow and presence indicated by the red color). During the second and third stimulation blocks, an augmentation of the population spike amplitude occurred during each train, which was significantly reduced by MK801. Similarly, the difference in the population spike latency between the first and last stimulus within one train was significantly reduced in the third stimulation block when MK801 was present (comparison with the control condition, *P<0.05, Student's t-test).
Figure 4
Figure 4
Effect of MK801 on the blood oxygen level-dependent (BOLD) response and evoked field potentials in the dentate gyrus during repetitive stimulation of the perforant pathway. (A) Development of the BOLD responses (area below the BOLD signal time course, see Figure 2C) under control (blue line) and test (application of MK801 after the first stimulus train, red line) condition. The development of BOLD responses did not differ significantly between both conditions. (B) Plotting the individual BOLD responses (abscissa) and the corresponding variations in the population spike latency (last population spike/first population spike (in %), ordinate) revealed an effect of MK801 only on the electrophysiological parameter. A clear separation of the Δ latency was observed in the third stimulation block, whereas the BOLD responses remained similar.
Figure 5
Figure 5
Development of the blood oxygen level-dependent (BOLD) response during application of MK801. The perforant pathway was stimulated with 3 consecutive stimulation blocks containing 10 low intensity stimulation trains. MK801 was again applied after the first stimulation block (green arrow), whereas the control group remained untreated. (A) BOLD response pattern caused by the stimulation and the measured regions: DG, ipsilateral (right) dentate gyrus; iEC, ipsilateral entorhinal cortex; cEC contralateral (left) entorhinal cortex. (B) 3D visualization of significant BOLD responses induced by repetitive low intensity stimulation trains. (CE) The elicited BOLD responses in these areas are shown again as in Figure 2. Again MK801 did not change significantly the BOLD response in the dentate gyrus, whereas the magnitude of the BOLD response in the right entorhinal cortex decreased significantly during the third stimulation block. No clear BOLD signals are elicited in the contralateral entorhinal cortex; therefore, no conclusions can be made (control group: n=6, test group: n=6, *P<0.05, Wilcoxon's test).
Figure 6
Figure 6
Development of the blood oxygen level-dependent (BOLD) response after MK801 was applied. (A) The perforant pathway was again stimulated with three consecutive stimulation blocks, starting with one block containing low intensity stimulation trains, followed by one block containing high intensity stimulation trains, and again a block with low intensity stimulation trains. (B) 3D visualization of significant BOLD responses induced by repetitive low intensity stimulation trains. During the first stimulation block, the BOLD response is restricted to the right hippocampus. Increasing the stimulation intensity during the second block caused a spreading of the BOLD response in the right hippocampal formation both in control and in MK801-treated animals. In MK801-treated animals, the spatial extend of the BOLD response was only reduced in the left entorhinal cortex region, consequently in the right hippocampus only the magnitude of the BOLD response is affected by MK801 but not the size of the activated region. (CE) The average magnitude of the BOLD response generated during the first block (solid line) was used as a comparative value for the elicited BOLD response generated during the second block (dashed line) and third block (dotted line). In the dentate gyrus of the control group (blue graphs in panel C), the average BOLD response during high intensity stimulation increased significantly, whereas in the test group (red graphs in panel C) this increase was absent. In both groups, the BOLD responses during the third stimulation block were significantly decreased compared with the first stimulation train. In the two other regions, the BOLD responses elicited in presence of MK801 were also reduced (D, E). In these regions, no significant changes between the first and last stimulation blocks were observed (control group: n=6, test group: n=6; *P<0.05, Wilcoxon's test).
Figure 7
Figure 7
Development of the population spike amplitude and latency in the right dentate gyrus when MK801 was applied before stimulation. Electrophysiological recordings were performed during acquisition of the functional magnetic resonance imaging (fMRI) data; thus, these data correspond to the blood oxygen level-dependent (BOLD) responses shown in Figure 6. When MK801 was already present before the stimulation starts an effect on the development of the population spike latency during the high intensity stimulation block was observed. The effect is clearest during the second high intensity stimulation train where the strong increase in the latency was almost absent, so that the latencies were almost similar during the entire second block. This was again paralleled with a smaller augmentation of the population spike amplitude during each high intensity stimulation train, however also with a stronger increase of the population spike latency within one stimulation train (comparison with the control condition, *P<0.05, Student's t-test).
Figure 8
Figure 8
Effect of MK801 on the blood oxygen level-dependent (BOLD) response and evoked field potentials in the dentate gyrus during repetitive stimulation of the perforant pathway. (A) Development of the BOLD responses (area below the BOLD signal time course, see Figure 1) under control (blue line) and test (application of MK801 before the first stimulus train, red line) condition. During the first low intensity stimulation block, no differences in the generated BOLD responses were observed. (B) During the high intensity stimulation block, the BOLD responses differed between both groups and a clear separation (indicated by the vertical and horizontal line) of BOLD responses and the development of the population spike latency was observed after the fourth stimulation train.

Similar articles

Cited by

References

    1. Angenstein F, Kammerer E, Niessen HG, Frey JU, Scheich H, Frey S. Frequency-dependent activation pattern in the rat hippocampus, a simultaneous electrophysiological and fMRI study. Neuroimage. 2007;38:150–163. - PubMed
    1. Angenstein F, Kammerer E, Scheich H. The BOLD response in the rat hippocampus depends rather on local processing of signals than on the input or output activity. A combined functional MRI and electrophysiological study. J Neurosci. 2009;29:2428–2439. - PMC - PubMed
    1. Angenstein F, Krautwald K, Scheich H. The current functional state of local neuronal circuits controls the magnitude of a BOLD response to incoming stimuli. Neuroimage. 2010;50:1364–1375. - PubMed
    1. Attwell D, Iadecola C. The neural basis of functional brain imaging signals. Trends Neurosci. 2002;25:621–625. - PubMed
    1. Busija DW, Bari F, Domoki F, Louis T. Mechanisms involved in the cerebrovascular dilator effects of N-methyl-d-aspartate in cerebral cortex. Brain Res Rev. 2007;56:89–100. - PMC - PubMed

Publication types

MeSH terms

LinkOut - more resources