. 2012 Feb;45(1):76-90.
doi: 10.1111/j.1365-2184.2011.00790.x. Epub 2011 Dec 14.

Improving the time-machine: estimating date of birth of grade II gliomas

Affiliations

Improving the time-machine: estimating date of birth of grade II gliomas

C Gerin et al. Cell Prolif. 2012 Feb.

Abstract

Objectives: Here we present a model aiming to provide an estimate of time from tumour genesis, for grade II gliomas. The model is based on a differential equation describing the diffusion-proliferation process. We have applied our model to situations where tumour diameter was shown to increase linearly with time, with characteristic diametric velocity.

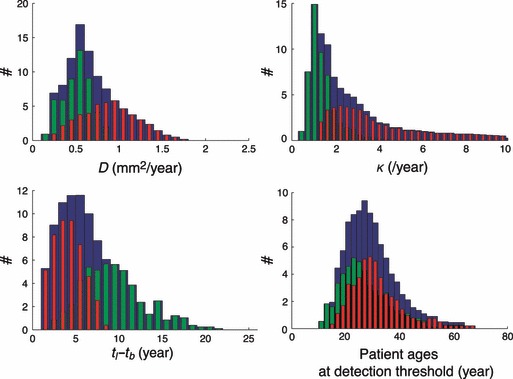
Materials and methods: We have performed numerical simulations to analyse data, on patients with grade II gliomas and to extract information concerning time of tumour biological onset, as well as radiology and distribution of model parameters.

Results and conclusions: We show that the estimate of tumour onset obtained from extrapolation using a constant velocity assumption, always underestimates biological tumour age, and that the correction one should add to this estimate is given roughly by 20/v (year), where v is the diametric velocity of expansion of the tumour (expressed in mm/year). Within the assumptions of the model, we have identified two types of tumour: the first corresponds to very slowly growing tumours that appear during adolescence, and the second type corresponds to slowly growing tumours that appear later, during early adulthood. That all these tumours become detectable around a mean patient age of 30 years could be interesting for formulation of strategies for early detection of tumours.


Figures

Figure 1
Figure 1
 Definition of the different times of tumour onsets used in the article. Top, left: Simulated radius of a tumour obtained from eqn (4) with κ = 1/year and v = 3 mm/year (v being the diametric velocity of expansion of the tumour) as a function of time. The continuous straight line materializes the asymptotic linear growth, while the dashed line corresponds to the tangent of the curve at the point r =1.5 cm. The slope of the continuous straight line coincides with half the value of the diametric velocity. Bottom, left: For the same tumour, cell density at r = 0. The grey band corresponds to the invisible phase of the tumour, when the cell density is smaller than the detection threshold (materialized by the horizontal dashed line at density equal to 0.02). Top, right: Different regimes for the evolution of the radius of a tumour. The plain line (κ = 1/year, D = 2.4 × 10−3 mm2/year) displays an invisible phase, whereas the dashed‐dotted (κ = 1/year, D = 2.1 × 10−3 mm2/year) and the dashed lines (κ = 1/year, D = 10−3 mm2/year) correspond to always visible tumours. Bottom, right: time difference t l − t b between the tumour onset predicted by the linear approximation and the biological onset of the tumour predicted by the proliferation–diffusion model as a function of the threshold ρ * (black line) and as a function of the initial radius r 0 of the tumour (grey line) where we have added the time necessary for the tumour to reach this radius r 0, starting from one cell and assuming a pure proliferation with the same coefficient (κ = 2/year and v = 4 mm/year).
Figure 2
Figure 2
 Time difference tl ‐ tb between the tumour onset predicted by the linear approximation and the biological onset of the tumour predicted by the proliferation‐diffusion model, represented in colour levels, in the (D, κ) plane. The grey zone corresponds to cases that do not fulfil the constraints, i.e. either the evolution of the radius is not linear at r = 15 mm or the radius r = 15 mm is not reached after 50 years of tumour growth.
Figure 3
Figure 3
 Patients ages and tumour radii at the time of the MRI examination (clinical data). Left: Distribution of patient ages at the time of the MRI examination for all patients (blue histogram, mean = 37.4 years, σ = 10.0 years), for patients with diametric velocities between 1 and 4 mm/year (green histogram, mean = 39.8 years, σ = 11.0 years) and for patients with velocities between 4 and 8 mm/year (red histogram, mean = 36.2 years, σ = 10.0 years). Right: Distribution of tumour radii at the time of the MRI examination for all patients (blue histogram, mean = 20.9 mm, σ = 5.7 mm), for patients with velocities between 1 and 4 mm/year (green histogram, mean = 20.8 mm, σ = 5.1 mm) and for patients with velocities between 4 and 8 mm/year (red histogram, mean = 22.1 mm, σ = 6.0 mm).
Figure 4
Figure 4
 Range of acceptable parameters of the model for each patient. Left: Superposition of the frontiers of the (D, κ) diagram of the Fig. 2 and the lines corresponding to the range of acceptable parameters D and κ for all patients. One coloured line corresponds to one patient. Right: the model‐obtained age of the tumour at the first MRI examination as a function of the diffusion coefficient for all patients. One coloured line corresponds to one patient.
Figure 5
Figure 5
 Calculated age of the patients at tumor onset and of the tumor at the time of the MRI examination. Left: Distribution of model‐obtained age of the patient at the onset of the tumour for all patients (blue histogram, mean = 18.1 years, σ = 9.6 years), for patients with velocities between 1 and 4 mm/year (green histogram, mean = 14.9 years, σ = 9.9 years) and for patients with velocities between 4 and 8 mm/year (red histogram, mean = 24.7 years, σ = 9.4 years). Right: Distributions of model‐obtained age of tumour at the time of MRI examination of all patients (blue histogram, mean = 17.6 years, σ = 9.6 years), for patients with velocities between 1 and 4 mm/year (green histogram, mean = 24.8 years, σ = 9.8 years) and for patients with velocities between 4 and 8 mm/year (red histogram, mean = 11.5 years, σ = 3.7 years).
Figure 6
Figure 6
 Acceptable parameters of the model and calculated time difference and patient age at detection threshold. Top, left: Distribution of values of D for all patients (blue histogram, mean = 0.6 mm2/year, σ = 0.3 mm2/year), for patients with velocities between 1 and 4 mm/year (green histogram, mean = 0.4 mm2/year, σ = 0.1 mm2/year) and for patients with velocities between 4 and 8 mm/year (red histogram, mean = 0.8 mm2/year, σ = 0.3 mm2/year). Top, right: Distribution of values of κ for all patients (blue histogram, mean = 2.7/year, σ = 2.2/year), for patients with velocities between 1 and 4 mm/year (green histogram, mean = 1.3/year, σ = 0.7/year) and for patients with velocities between 4 and 8 mm/year (red histogram, mean = 3.9/year, σ = 2.2/year). Bottom left: distribution of the time difference t l − t b between the tumour onset predicted by the linear approximation and the biological onset of the tumour predicted by the proliferation–diffusion model for all patients (blue histogram, mean = 6.1 years, σ = 3.8 years), for patients with velocities between 1 and 4 mm/year (green histogram, mean = 8.9 years, σ = 3.6 years) and for patients with velocities between 4 and 8 mm/year (red histogram, mean = 3.7 years, σ = 1.6 years). Bottom right: Distribution of patient ages at the time of detection of the tumour for all patients (blue histogram, mean = 28.4 years, σ = 9.5 years), for patients with velocities between 1 and 4 mm/year (green histogram, mean = 26.4 years, σ = 9.3 years) and for patients with velocities between 4 and 8 mm/year (red histogram, mean = 30.0 years, σ: 9.0 years).
Figure 7
Figure 7
 Evolution of the mean calculated tumor age at time of MRI examination, patient age at the tumour onset and time difference as a function of the growth velocity of the tumour. In this figure, patients have been divided into five small groups according to their velocity. The first group contains patients with velocities between 1 and 3 mm/year, the second between 3 and 4.5 mm/year, the third between 4.5 and 6 mm/year, the fourth between 6 and 8 mm/year. A fifth group with velocities between 8 and 20 mm/year has been considered only for this figure, as it follows the same tendency as the others. The evolution of the means of population distributions are depicted here. Evolution of the mean tumour age at the time of the MRI examination (stars), of the mean patient age at the onset of the tumour (plain circles), of the mean time difference t l − t b between the tumour onset predicted by the linear approximation and the biological onset of the tumour predicted by the proliferation–diffusion model (diamonds), as a function of the growth velocity of the tumour v. The error bars represent the standard deviations. The curve of t l − t b as a function of the velocity v can be roughly fitted by the function 20/v (year), with v expressed in mm/year (grey line) (it is not the better fit, but we preferred a simple formula).
Figure 8
Figure 8
 Distributions for asymptomatic patients. Left: Distribution of tumour ages at time of the first MRI examination (calculated with the model) for all asymptomatic patients (blue histogram, the mean is not representative), for patients with velocities between 1 and 4 mm/year (green histogram, the mean is also not representative) and for patients with velocities between 4 and 8 mm/year (red histogram, mean = 7.8 years, σ = 3.3 years). Right: Radius of the tumour versus the age of the patient studied in (38) with two different proliferation coefficients κ = 1.5/year (thin line) and κ = 5.7/year (thick line). The biological onsets of the tumour in each case t b1 and t b2 are indicated by small vertical bars. t MRI1 and t MRI2 (dashed arrows) indicate the two MRI examinations that the patient underwent.

References

    1. Louis DN, Ohgaki H, Wiestler OD, Cavenee WK, Burger PC, Jouvet A et al. (2007) The 2007 WHO classification of tumours of the central nervous system. Acta Neuropathol. 114, 97–109. - PMC - PubMed
    1. Kelly PJ, Daumas‐Duport C, Kispert DB, Kall BA, Scheithauer W, Illig J (1987) Imaging‐based stereotaxic serial biopsies in untreated intracranial glial neaplasms. J. Neurosurg. 66, 865–874. - PubMed
    1. Pallud J, Varlet P, Devaux B, Geha S, Badoual M, Deroulers C et al. (2010) Diffuse low‐grade oligodendrogliomas extend beyond MRI‐defined abnormalities. Neurology 74, 1724–1731. - PubMed
    1. Keles GE, Lamborn KR, Berger MS (2001) Low‐grade hemispheric gliomas in adults: a critical review of extent of resection as a factor influencing outcome. J. Neurosurg. 95, 735–745. - PubMed
    1. Salgaller ML, Liau LM (2006) Current status of clinical trials for glioblastoma. Rev. Recent Clin. Trials 3, 265–281. - PubMed

Publication types