

A study of the hydration of the alkali metal ions in aqueous solution
- PMID: 22168370
- PMCID: PMC3250073
- DOI: 10.1021/ic2018693
A study of the hydration of the alkali metal ions in aqueous solution
Abstract
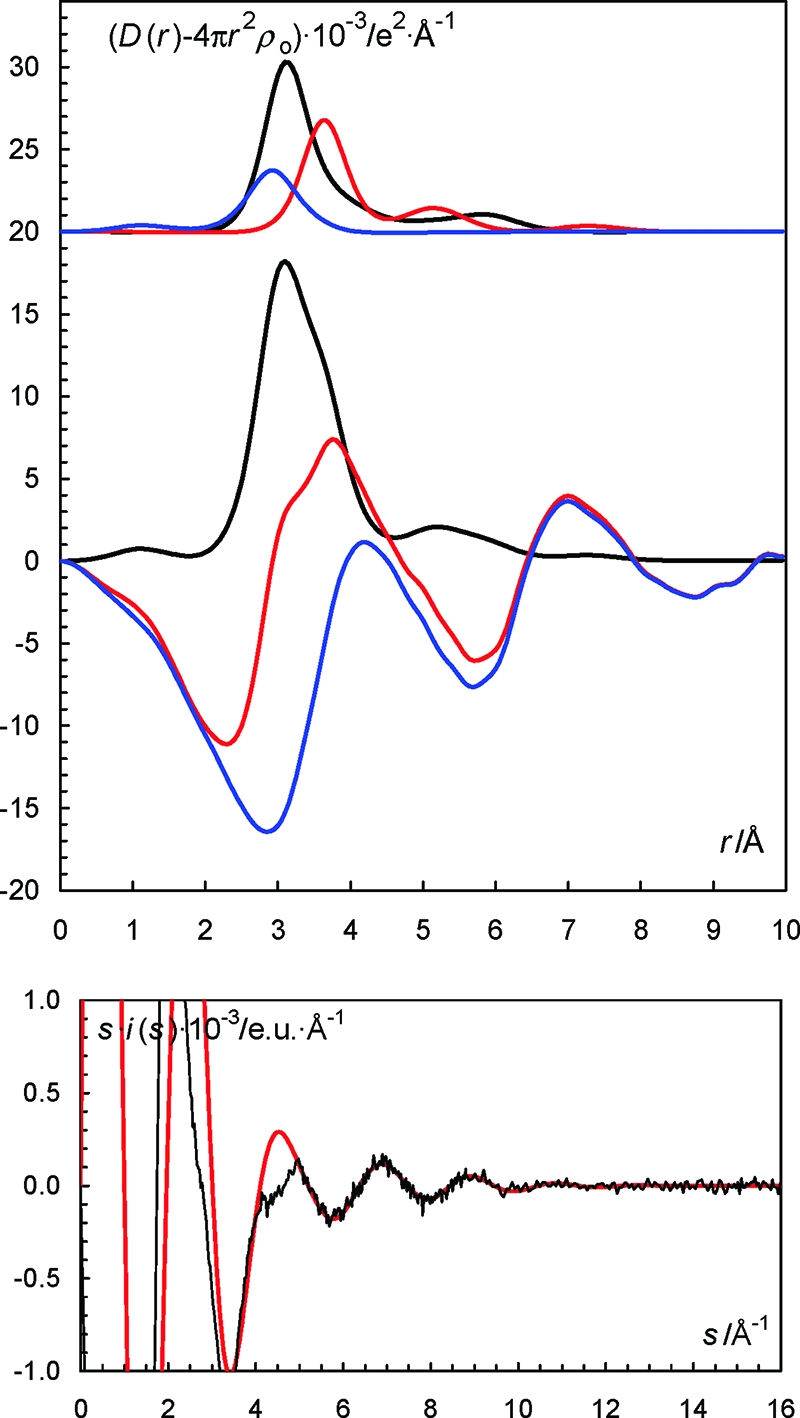
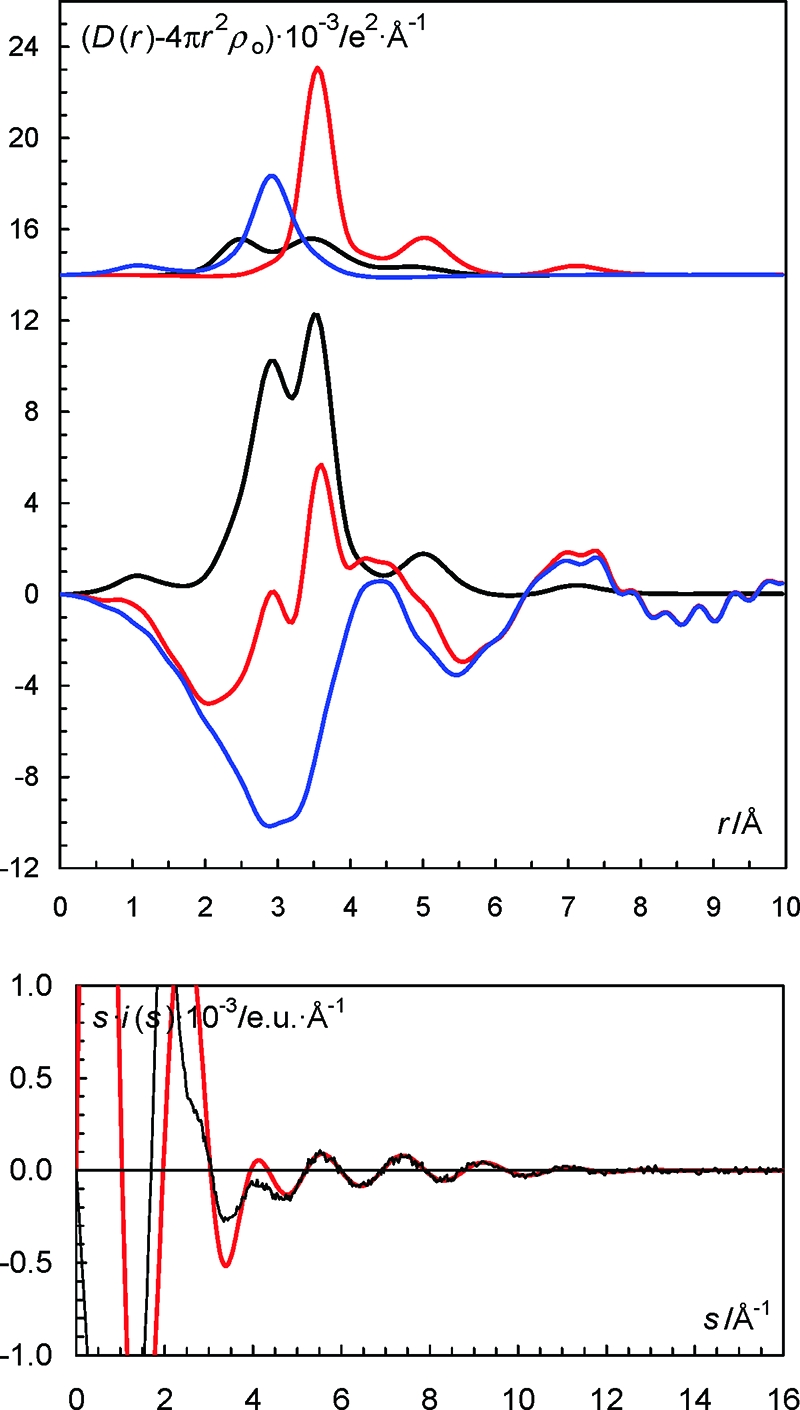
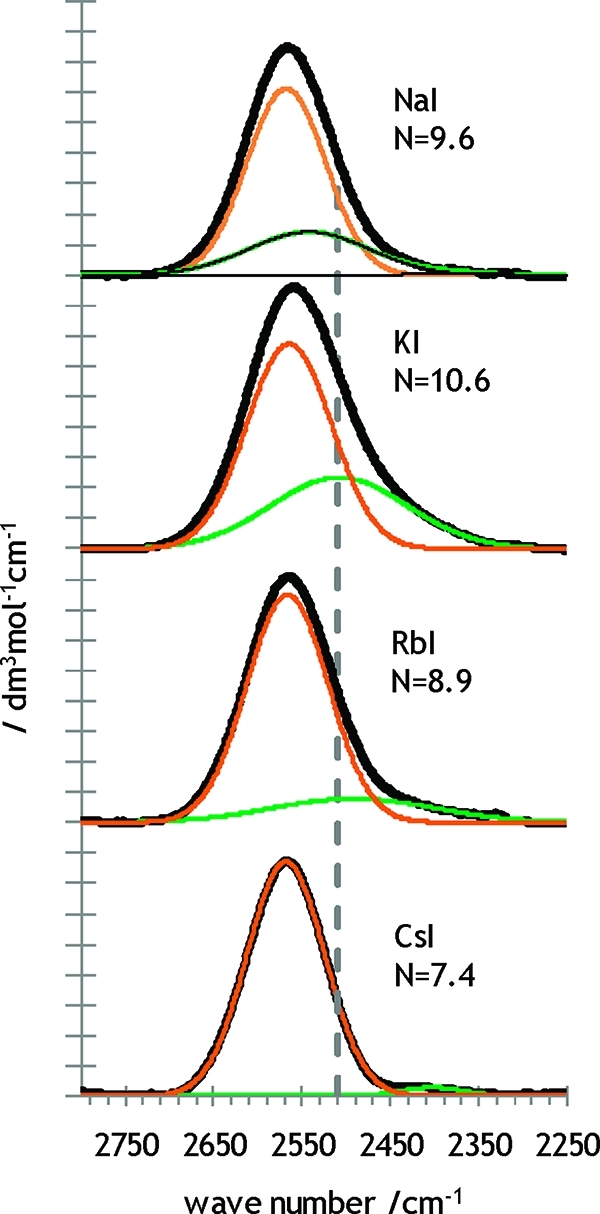
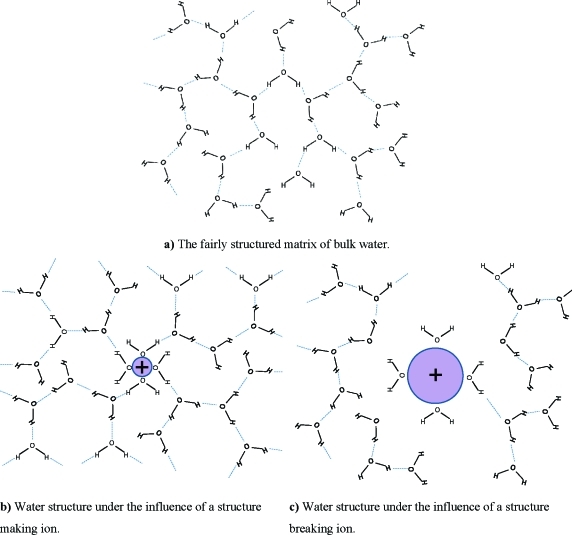
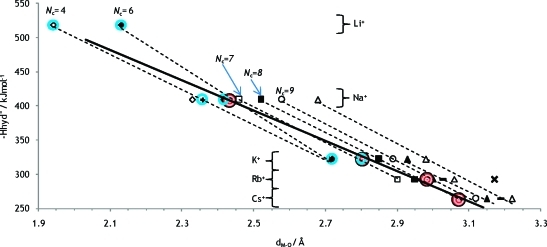
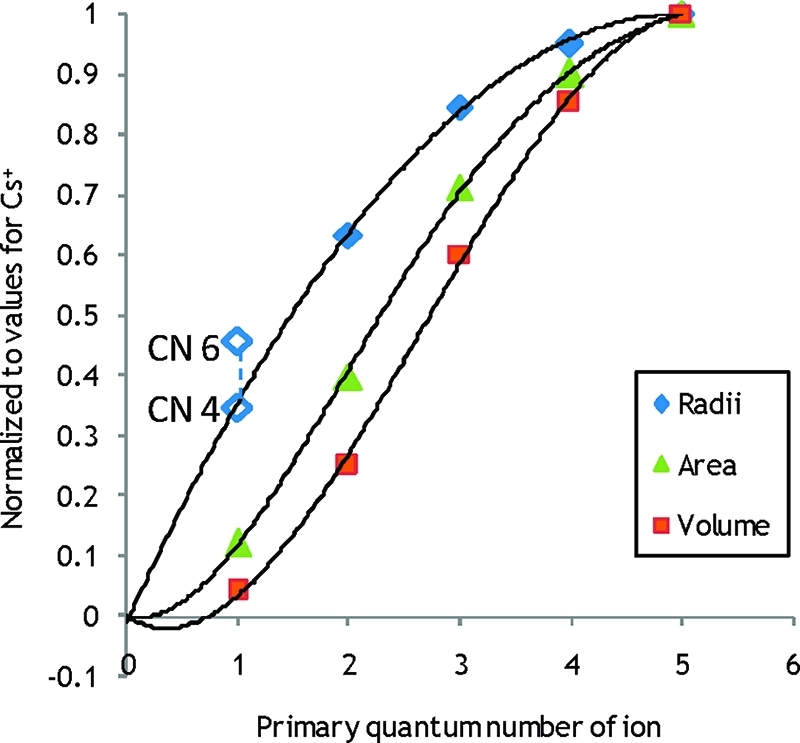
The hydration of the alkali metal ions in aqueous solution has been studied by large angle X-ray scattering (LAXS) and double difference infrared spectroscopy (DDIR). The structures of the dimethyl sulfoxide solvated alkali metal ions in solution have been determined to support the studies in aqueous solution. The results of the LAXS and DDIR measurements show that the sodium, potassium, rubidium and cesium ions all are weakly hydrated with only a single shell of water molecules. The smaller lithium ion is more strongly hydrated, most probably with a second hydration shell present. The influence of the rubidium and cesium ions on the water structure was found to be very weak, and it was not possible to quantify this effect in a reliable way due to insufficient separation of the O-D stretching bands of partially deuterated water bound to these metal ions and the O-D stretching bands of the bulk water. Aqueous solutions of sodium, potassium and cesium iodide and cesium and lithium hydroxide have been studied by LAXS and M-O bond distances have been determined fairly accurately except for lithium. However, the number of water molecules binding to the alkali metal ions is very difficult to determine from the LAXS measurements as the number of distances and the temperature factor are strongly correlated. A thorough analysis of M-O bond distances in solid alkali metal compounds with ligands binding through oxygen has been made from available structure databases. There is relatively strong correlation between M-O bond distances and coordination numbers also for the alkali metal ions even though the M-O interactions are weak and the number of complexes of potassium, rubidium and cesium with well-defined coordination geometry is very small. The mean M-O bond distance in the hydrated sodium, potassium, rubidium and cesium ions in aqueous solution have been determined to be 2.43(2), 2.81(1), 2.98(1) and 3.07(1) Å, which corresponds to six-, seven-, eight- and eight-coordination. These coordination numbers are supported by the linear relationship of the hydration enthalpies and the M-O bond distances. This correlation indicates that the hydrated lithium ion is four-coordinate in aqueous solution. New ionic radii are proposed for four- and six-coordinate lithium(I), 0.60 and 0.79 Å, respectively, as well as for five- and six-coordinate sodium(I), 1.02 and 1.07 Å, respectively. The ionic radii for six- and seven-coordinate K(+), 1.38 and 1.46 Å, respectively, and eight-coordinate Rb(+) and Cs(+), 1.64 and 1.73 Å, respectively, are confirmed from previous studies. The M-O bond distances in dimethyl sulfoxide solvated sodium, potassium, rubidium and cesium ions in solution are very similar to those observed in aqueous solution.
Figures


Similar articles
-
Coordination chemistry study of hydrated and solvated lead(II) ions in solution and solid state.Inorg Chem. 2011 Feb 7;50(3):1058-72. doi: 10.1021/ic1017714. Epub 2011 Jan 12. Inorg Chem. 2011. PMID: 21226482
-
Structure of the hydrated and dimethyl sulfoxide solvated rubidium ions in solution.Inorg Chem. 2004 May 31;43(11):3543-9. doi: 10.1021/ic030310t. Inorg Chem. 2004. PMID: 15154820
-
Steric effects control the structure of the solvated lanthanum(III) ion in aqueous, dimethyl sulfoxide, and N,N'-dimethylpropyleneurea solution. An EXAFS and large-angle X-ray scattering study.Inorg Chem. 2000 Sep 4;39(18):4006-11. doi: 10.1021/ic991208s. Inorg Chem. 2000. PMID: 11198854
-
Coordination numbers of alkali metal ions in aqueous solutions.Biophys Chem. 2006 Dec 1;124(3):192-9. doi: 10.1016/j.bpc.2006.07.002. Epub 2006 Jul 27. Biophys Chem. 2006. PMID: 16875774 Review.
-
Novel and Sustainable Materials for the Separation of Lithium, Rubidium, and Cesium Ions from Aqueous Solutions in Adsorption Processes-A Review.Materials (Basel). 2024 Dec 17;17(24):6158. doi: 10.3390/ma17246158. Materials (Basel). 2024. PMID: 39769760 Free PMC article. Review.
Cited by
-
Structural basis for ion permeation mechanism in pentameric ligand-gated ion channels.EMBO J. 2013 Mar 6;32(5):728-41. doi: 10.1038/emboj.2013.17. Epub 2013 Feb 12. EMBO J. 2013. PMID: 23403925 Free PMC article.
-
Ion distributions around left- and right-handed DNA and RNA duplexes: a comparative study.Nucleic Acids Res. 2014 Dec 16;42(22):13981-96. doi: 10.1093/nar/gku1107. Epub 2014 Nov 26. Nucleic Acids Res. 2014. PMID: 25428372 Free PMC article.
-
Adopting the principles of collagen biomineralization for intrafibrillar infiltration of yttria-stabilized zirconia into three-dimensional collagen scaffolds.Adv Funct Mater. 2014 Apr 2;24(13):1895-1903. doi: 10.1002/adfm.201302920. Adv Funct Mater. 2014. PMID: 25477773 Free PMC article.
-
Probing ion-specific effects on aqueous acetate solutions: Ion pairing versus water structure modifications.Struct Dyn. 2014 Jun 18;1(3):034901. doi: 10.1063/1.4884600. eCollection 2014 May. Struct Dyn. 2014. PMID: 26798780 Free PMC article.
-
Towards a Unified Understanding of Lithium Action in Basic Biology and its Significance for Applied Biology.J Membr Biol. 2017 Dec;250(6):587-604. doi: 10.1007/s00232-017-9998-2. Epub 2017 Nov 10. J Membr Biol. 2017. PMID: 29127487 Free PMC article. Review.
References
-
- Restrepo-Angulo I.; De Vizcaya-Ruiz A.; Camacho J. J. Appl. Toxicol. 2010, 30, 497–512. - PubMed
-
- Tarascon J. M.; Armand M. Nature 2001, 414, 359–367. - PubMed
-
- Greenwood N. N.; Earnshaw A.. Chemistry of the Elements, 2nd ed.; Butterworth-Heinemann: Oxford, 1997; pp 781–782.
-
- Avery S. J. Chem. Technol. Biotechnol. 1995, 62, 3–16.
-
- Ohtaki H.; Radnai T. Chem. Rev. 1993, 93, 1157–1204.
Publication types
MeSH terms
Substances
LinkOut - more resources
Full Text Sources
Other Literature Sources
