. 2012 Feb 29;53(2):1066-75.
doi: 10.1167/iovs.11-8767. Print 2012 Feb.

Optimization of in vivo confocal autofluorescence imaging of the ocular fundus in mice and its application to models of human retinal degeneration

Affiliations

Optimization of in vivo confocal autofluorescence imaging of the ocular fundus in mice and its application to models of human retinal degeneration

Peter Charbel Issa et al. Invest Ophthalmol Vis Sci. .

Abstract

Purpose: To investigate the feasibility and to identify sources of experimental variability of quantitative and qualitative fundus autofluorescence (AF) assessment in mice.

Methods: Blue (488 nm) and near-infrared (790 nm) fundus AF imaging was performed in various mouse strains and disease models (129S2, C57Bl/6, Abca4(-/-), C3H-Pde6b(rd1/rd1), Rho(-/-), and BALB/c mice) using a commercially available scanning laser ophthalmoscope. Gray-level analysis was used to explore factors influencing fundus AF measurements.

Results: A contact lens avoided cataract development and resulted in consistent fundus AF recordings. Fundus illumination and magnification were sensitive to changes of the camera position. Standardized adjustment of the recorded confocal plane and consideration of the pupil area allowed reproducible recording of fundus AF from the retinal pigment epithelium with an intersession coefficient of repeatability of ±22%. Photopigment bleaching occurred during the first 1.5 seconds of exposure to 488 nm blue light (∼10 mW/cm(2)), resulting in an increase of fundus AF. In addition, there was a slight decrease in fundus AF during prolonged blue light exposure. Fundus AF at 488 nm was low in animals with an absence of a normal visual cycle, and high in BALB/c and Abca4(-/-) mice. Degenerative alterations in Pde6b(rd1/rd1) and Rho(-/-) were reminiscent of findings in human retinal disease.

Conclusions: Investigation of retinal phenotypes in mice is possible in vivo using standardized fundus AF imaging. Correlation with postmortem analysis is likely to lead to further understanding of human disease phenotypes and of retinal degenerations in general. Fundus AF imaging may be useful as an outcome measure in preclinical trials, such as for monitoring effects aimed at lowering lipofuscin accumulation in the retinal pigment epithelium.


Figures
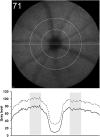
Figure 1.
Figure 1.
Quantitative gray level (GL) analysis of fundus autofluorescence (AF) images. The dashed line in the graph (bottom) represents the GL profile along the horizontal 30 pixels wide band (top). The continuous line in the graph represents the corrected GL (cGL), which results after subtracting the zero-GL and which is used for all comparisons. The mean cGL within an annular area, concentric to the optic disc center, defined by circles with 250 and 450 pixels radius (gray background, bottom graph), was used for all quantitative GL measurements (indicated in the left upper corner; range 0–255 minus zero-GL). This sampling area avoids the optic disc and the more peripheral part of the image, where darkening and distortion are usually observed.
Figure 2.
Figure 2.
Prevention of media opacity using a contact lens. Cataract development in anesthetized mice with dilated pupils, without measures to prevent corneal desiccation, results in image deterioration within minutes (upper row). Quantification of the decreasing fundus AF (normalized to the first measurement at 0 minutes) is shown in the graph (triangles). Such media opacity can be avoided by protecting the cornea from drying using a contact lens (lower row, horizontal bars). A similar but less consistent effect can be achieved using a corneal lubricant (circles). cGL, corrected gray level.
Figure 3.
Figure 3.
Correct placement of the contact lens (CL) is necessary for recording images with even illumination of the fundus (upper row). Displacement of the contact lens results in shadowing of the fundus image (lower row; arrows mark lens margin). Adequate lens position can be controlled using the cSLO image focused on the anterior segment (e.g., +50 D).
Figure 4.
Figure 4.
Influence of camera position on fundus shadowing and magnification. Misalignment from an optimized camera position results in peripheral image shadowing (upper row). Changes of the camera position in the z-axis led to significant changes in image magnification and thus influenced the scale factor (bottom row). The focus was readjusted for each camera position. A degenerated retina was recorded using the NIR reflectance mode because of the superior visibility of the disc margin.
Figure 5.
Figure 5.
Dioptric shift with change in illumination wavelength. When using the 820 nm reflectance image for positioning of the camera and locating the confocal plane of interest (upper left), the 488 nm fundus AF image is not in focus (upper right; the vascular walls are visible because of expression of the fluorescent reporter protein DsRed under control of the actin promoter). The confocal plane must be corrected by approximately 8 D. Images are cropped from images recorded with the 55° field lens.
Figure 6.
Figure 6.
(A) Pupil size increases with age, especially during the first 3 months of life. (B) Effect of different pupil diameters on AF measurement, exemplified in a 5-month-old Abca4−/− mouse. The midperipheral cGL was measured (indicated in the upper left corner of each fundus image). Insets: NIR iris images recorded immediately after the AF image. (C) Log-log plots showing the variation of fundus AF with pupil diameter for five eyes (different symbols, minimum of four measures per eye). The curves were slightly displaced vertically for clarity (≤5%). Interrupted line: theoretical prediction of how AF would change with change in pupil diameter in the assumptions those pupils are concentric with the iris, that the laser irradiance in the scan pupil is uniform, and that the pupil diameter is recorded at the same time as the fundus AF image. Arrows: diameters of the scan pupil (S) and the detection pupil (D), respectively. Black horizontal bar: range of pupil diameters for all other instances in this study.
Figure 7.
Figure 7.
Recording AF from the RPE in mice. (A) Effect of defocus from a reference plane, defined as the confocal plane with the highest reflectivity in the NIR reflectance mode. AF images were recorded in 2 D steps in a range of ±10 D defocus from the reference plane and 5 D steps outside this range up to ±25 D defocus; n = 13. Mean ± SD. (B) Bland-Altman plot of percentage difference against mean for quantitative fundus AF measurements (cGL). Continuous line: mean difference; dashed lines: 95% limits of agreement.
Figure 8.
Figure 8.
Effect of blue light exposure on the measured fundus AF signal. (A) Photopigment bleaching increases fundus AF considerably within the first 1.5 seconds of blue light exposure in wild-type C57Bl/6 mice. This increase is not seen in Rho−/− mice that lack photopigment. The mean ± SEM of four independent measurements is shown. (insets) Enhanced fundus differential maps (at 2 seconds minus baseline) in wild-type (top) and Rho−/− mice (bottom). (B) During continuous light exposure over 3 minutes (lower horizontal white bar), there is an approximately 15% decrease in measured fundus AF (circles, solid line). A similar change was observed after a 3-minute interval without light exposure, during which AF remained stable (upper black and white horizontal bar). The mean ± SEM of four independent measurements in C57Bl/6 mice is shown.
Figure 9.
Figure 9.
Pattern and corrected gray level (cGL; representing fundus AF intensity) on 488 nm and 790 nm fundus AF images in three wild-type mouse strains and an Abca4−/− mouse at 6 months of age. Standardized image acquisition and detector settings allow quantification and comparison of the AF intensity. The numbers in the left upper corner of each fundus image represent the mean cGL measured in the midperiphery. The horizontal cGL profile through the optic disc is shown in the bottom line plots for 488 nm (left) and 790 nm (right) fundus AF images. Pupil diameter was 2.2, 2.33, and 2.26 mm in the WT129, C57Bl/6, and Abca4−/− mice, respectively, and was not recorded in the BALB/c mouse because of the translucent iris.
Figure 10.
Figure 10.
GL (A) and pattern (B, contrast enhanced) fundus AF images in two mouse models for retinal dystrophies. (A) Both models have a lack of photoreceptor outer segment shedding and thus do not accumulate lipofuscin, resulting in a reduced AF compared with an age-matched wild-type mouse. Pupil diameter was 2.23, 2.28, and 2.30 mm in the C57Bl/6, Rho−/−, and Pde6brd1/rd1 mouse, respectively. cGL, corrected gray level. (B) Histogram stretching and contrast enhancement reveals a pattern of further decreased AF that first appears on 790 nm AF images. All alterations occur earlier in the faster progressing Pde6brd1/rd1 model. Rho−/−, rhodopsin knockout mouse. Pde6brd1/rd1, nonsense mutation in Pde6b.

References

    1. Rivas MA, Vecino E. Animal models and different therapies for treatment of retinitis pigmentosa. Histol Histopathol. 2009;24:1295–1322 - PubMed
    1. Paques M, Simonutti M, Roux M, et al. High resolution fundus imaging by confocal scanning laser ophthalmoscopy in the mouse. Vision Res. 2006;46:1336–1345 - PubMed
    1. Seeliger MW, Beck SC, Pereyra-Muñoz N, et al. In vivo confocal imaging of the retina in animal models using scanning laser ophthalmoscopy. Vision Res. 2005;45:3512–3519 - PubMed
    1. Fischer MD, Huber G, Beck SC, et al. Noninvasive, in vivo assessment of mouse retinal structure using optical coherence tomography. PLoS One. 2009;4:e7507. - PMC - PubMed
    1. Schmitz-Valckenberg S, Holz FG, Bird AC, Spaide RF. Fundus autofluorescence imaging: review and perspectives. Retina. 2008;28:385–409 - PubMed

Publication types