Review
. 2012 Jan;16(1):17-26.
doi: 10.1016/j.tics.2011.11.007. Epub 2011 Dec 12.

Large-scale brain systems in ADHD: beyond the prefrontal-striatal model

Affiliations
Review

Large-scale brain systems in ADHD: beyond the prefrontal-striatal model

F Xavier Castellanos et al. Trends Cogn Sci. 2012 Jan.

Abstract

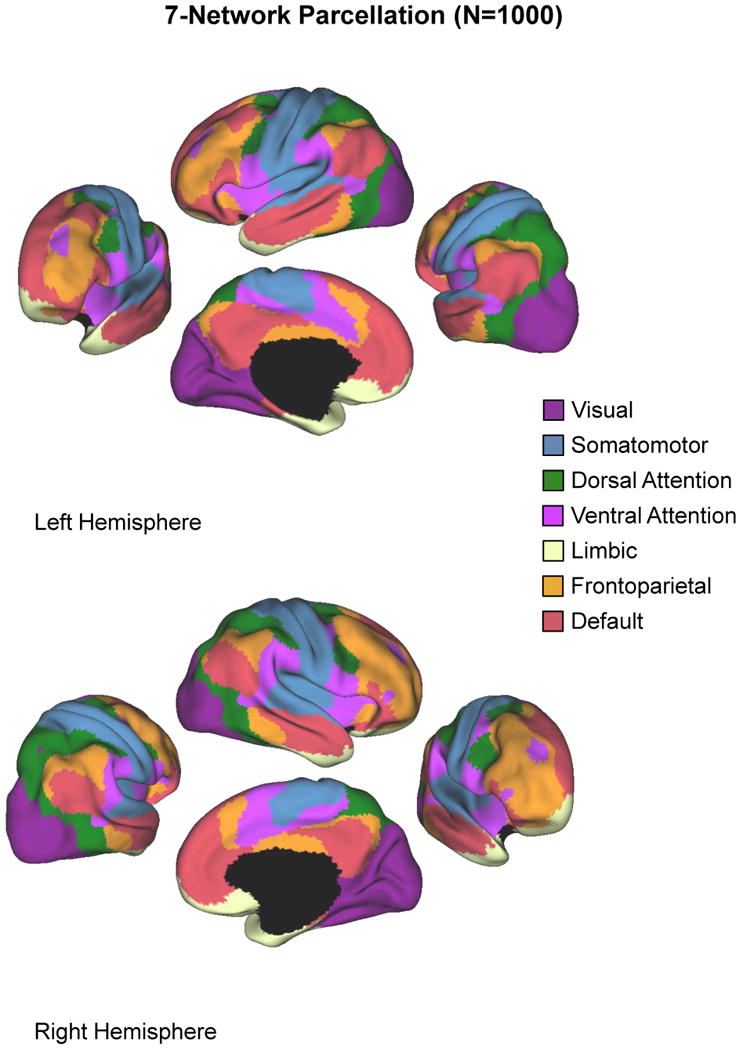
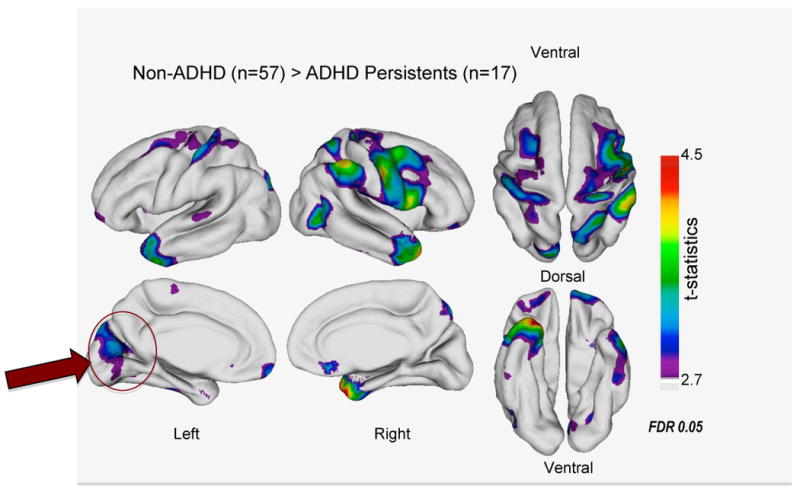
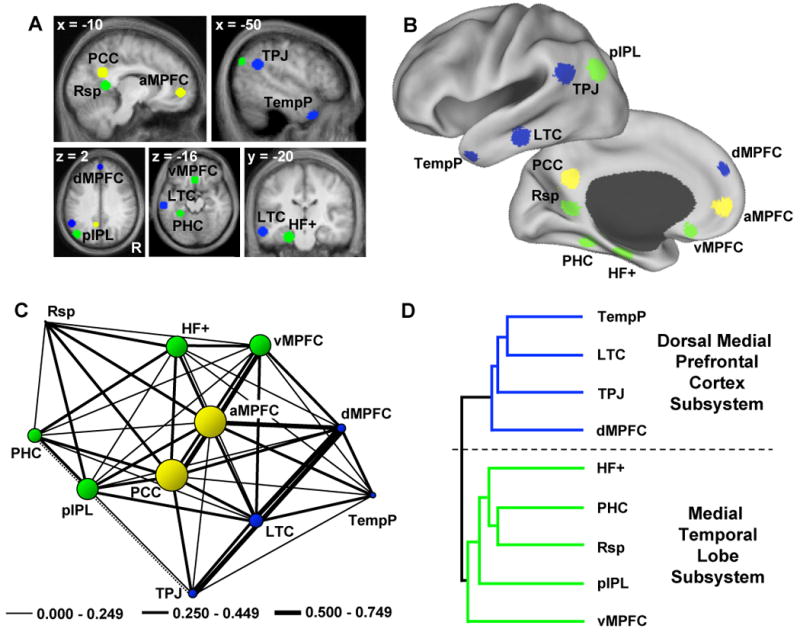
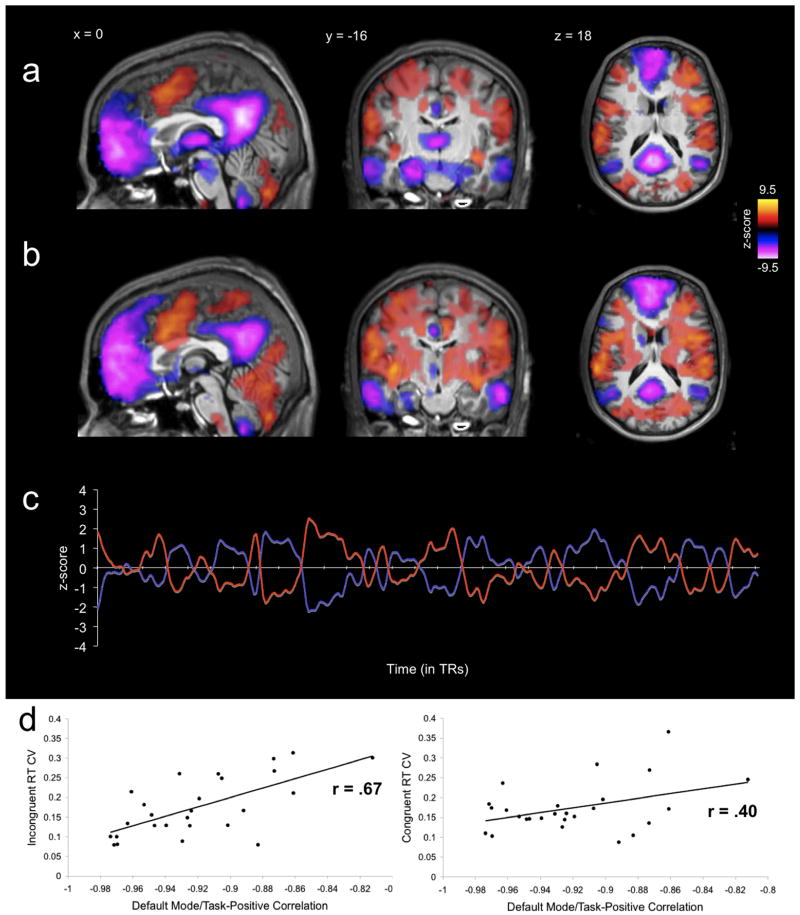
Attention-deficit/hyperactivity disorder (ADHD) has long been thought to reflect dysfunction of prefrontal-striatal circuitry, with involvement of other circuits largely ignored. Recent advances in systems neuroscience-based approaches to brain dysfunction have facilitated the development of models of ADHD pathophysiology that encompass a number of different large-scale resting-state networks. Here we review progress in delineating large-scale neural systems and illustrate their relevance to ADHD. We relate frontoparietal, dorsal attentional, motor, visual and default networks to the ADHD functional and structural literature. Insights emerging from mapping intrinsic brain connectivity networks provide a potentially mechanistic framework for an understanding of aspects of ADHD such as neuropsychological and behavioral inconsistency, and the possible role of primary visual cortex in attentional dysfunction in the disorder.


Figures

Figure 1
Figure 1. Coarse (7-network) parcellation of the human cerebral cortex obtained through clustering of R-fMRI data of 1,000 subjects
At this resolution, association cortex is distinguished from primary sensorimotor cortex. The association networks converged on and extended networks previously described in the resting-state literature, including the dorsal attention, ventral attention, frontoparietal control, and default networks. Adapted, with permission, from [12].
Figure 2
Figure 2. Cortical thickness analysis reveals occipital involvement in ADHD
In a 33-year longitudinal follow-up study, adults with ADHD persisting from childhood showed significantly decreased cortical thickness in multiple regions, including medial occipital cortex (arrow) relative to non-ADHD controls. Reproduced, with permission, from [9].
Figure 3
Figure 3. Fractionation of the default network
Default network core hubs are shown in yellow, the dorsomedial prefrontal cortex subsystem is shown in blue, and the regions comprising the medial temporal lobe subsystem are in green. (a) Shows the 11 seeds defined a priori using functional connectivity approaches. (b) The 11 seeds projected onto an inflated brain. (c) The correlation strengths among the regions within the default network are shown using network centrality measures. The size of the circle represents the centrality of a given node. The anterior medial prefrontal cortex (aMPFC) and posterior cingulate cortex (PCC) are the core hubs of the network and both are significantly connected to every other node. Negative correlations are shown with a dotted line. (d) Represents the two clusters resulting from centrality analyses. dMPFC: dorsomedial prefrontal cortex; TPJ: temporoparietal junction; LTC: lateral temporal cortex; TempP: temporal pole; vMPFC: ventromedial prefrontal cortex; pIPL: posterior inferior parietal lobe; Rsp: retrosplenial cortex; PHC: parahippocampal cortex; HF+: hippocampal formation. Reproduced, with permission, from [34].
Figure 4
Figure 4. Anticorrelations between neural networks
(a) Mid-sagittal, coronal and axial views of anticorrelated networks extracted through region-of-interest based functional connectivity analyses by. The “task positive network” shown in yellow-orange includes the frontoparietal network; the default network is shown in purple. (b) Mid-sagittal, coronal and axial views of anticorrelated networks extracted through independent component analyses showing substantial overlap of the two methods. The frontoparietal network is shown in yellow-orange and the default network in purple. (c) Time series of default and frontoparietal networks for one participant with Pearson r= - 0.97 during performance of slow event-related Eriksen Flanker task. The strength of this relationship was negatively related to intra-subject variability of response times across participants. Reproduced, with permission, from [76].

References

    1. American Psychiatric Association. Diagnostic and Statistical Manual of Mental Disorders, Fourth Edition, Text Revision. American Psychiatric Association; 2000.
    1. Polanczyk G, et al. The worldwide prevalence of ADHD: a systematic review and metaregression analysis. Am J Psychiatry. 2007;164:942–948. - PubMed
    1. Centers for Disease Control. Increasing prevalence of parent-reported attention-deficit/hyperactivity disorder among children --- United States, 2003 and 2007. MMWR Morb Mortal Wkly Rep. 2010;59:1439–1443. - PubMed
    1. Simon V, et al. Prevalence and correlates of adult attention-deficit hyperactivity disorder: meta-analysis. Br J Psychiatry. 2009;194:204–211. - PubMed
    1. Krain AL, Castellanos FX. Brain development and ADHD. Clin Psychol Rev. 2006;26:433–444. - PubMed

MeSH terms