

Fine mapping of a QTL on chromosome 13 for submaximal exercise capacity training response: the HERITAGE Family Study
- PMID: 22170014
- PMCID: PMC4109813
- DOI: 10.1007/s00421-011-2274-8
Fine mapping of a QTL on chromosome 13 for submaximal exercise capacity training response: the HERITAGE Family Study
Abstract
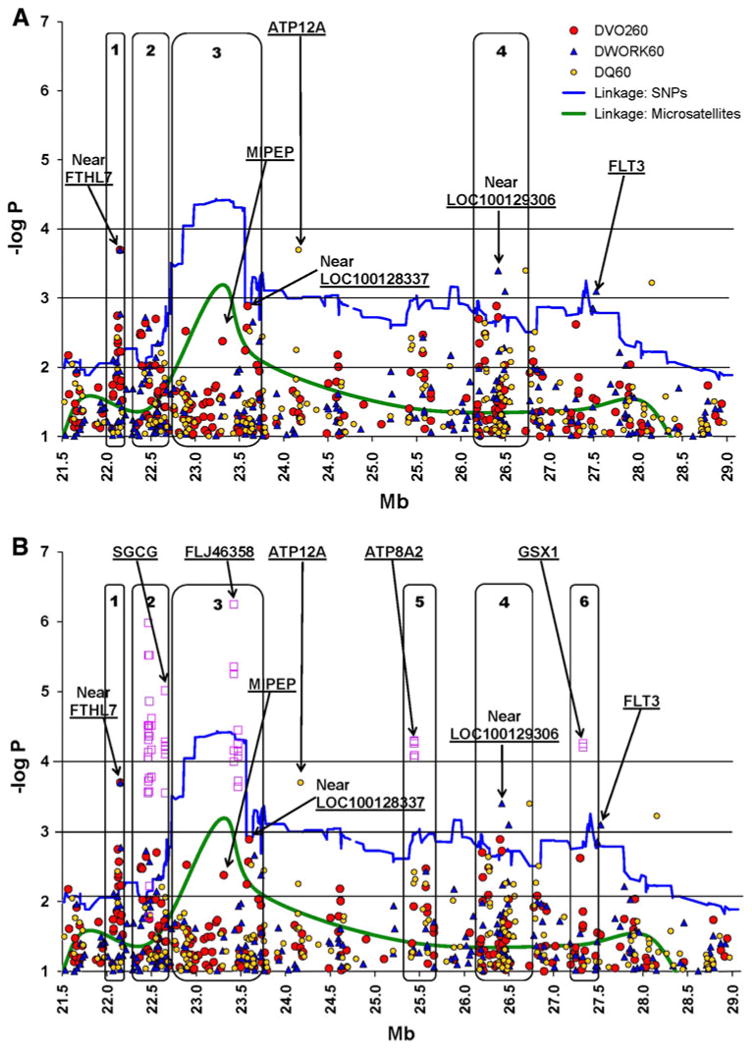
Although regular exercise improves submaximal aerobic capacity, there is large variability in its response to exercise training. While this variation is thought to be partly due to genetic differences, relatively little is known about the causal genes. Submaximal aerobic capacity traits in the current report include the responses of oxygen consumption (ΔVO(2)60), power output (ΔWORK60), and cardiac output (ΔQ60) at 60% of VO2max to a standardized 20-week endurance exercise training program. Genome-wide linkage analysis in 475 HERITAGE Family Study Caucasians identified a locus on chromosome 13q for ΔVO(2)60 (LOD = 3.11). Follow-up fine mapping involved a dense marker panel of over 1,800 single-nucleotide polymorphisms (SNPs) in a 7.9-Mb region (21.1-29.1 Mb from p-terminus). Single-SNP analyses found 14 SNPs moderately associated with both ΔVO(2)60 at P ≤ 0.005 and the correlated traits of ΔWORK60 and ΔQ60 at P < 0.05. Haplotype analyses provided several strong signals (P < 1.0 × 10(-5)) for ΔVO(2)60. Overall, association analyses narrowed the target region and included potential biological candidate genes (MIPEP and SGCG). Consistent with maximal heritability estimates of 23%, up to 20% of the phenotypic variance in ΔVO(2)60 was accounted for by these SNPs. These results implicate candidate genes on chromosome 13q12 for the ability to improve submaximal exercise capacity in response to regular exercise. Submaximal exercise at 60% of maximal capacity is an exercise intensity that falls well within the range recommended in the Physical Activity Guidelines for Americans and thus has potential public health relevance.
Conflict of interest statement
Figures
Similar articles
-
Genome-wide linkage scan for submaximal exercise heart rate in the HERITAGE family study.Am J Physiol Heart Circ Physiol. 2007 Dec;293(6):H3366-71. doi: 10.1152/ajpheart.00042.2007. Epub 2007 Oct 5. Am J Physiol Heart Circ Physiol. 2007. PMID: 17921336
-
Heritability of submaximal exercise heart rate response to exercise training is accounted for by nine SNPs.J Appl Physiol (1985). 2012 Mar;112(5):892-7. doi: 10.1152/japplphysiol.01287.2011. Epub 2011 Dec 15. J Appl Physiol (1985). 2012. PMID: 22174390 Free PMC article.
-
CREB1 is a strong genetic predictor of the variation in exercise heart rate response to regular exercise: the HERITAGE Family Study.Circ Cardiovasc Genet. 2010 Jun;3(3):294-9. doi: 10.1161/CIRCGENETICS.109.925644. Epub 2010 Apr 20. Circ Cardiovasc Genet. 2010. PMID: 20407090 Free PMC article.
-
Quantitative trait loci for maximal exercise capacity phenotypes and their responses to training in the HERITAGE Family Study.Physiol Genomics. 2004 Jan 15;16(2):256-60. doi: 10.1152/physiolgenomics.00035.2003. Physiol Genomics. 2004. PMID: 14625375
-
Personalized preventive medicine: genetics and the response to regular exercise in preventive interventions.Prog Cardiovasc Dis. 2015 Jan-Feb;57(4):337-46. doi: 10.1016/j.pcad.2014.08.005. Epub 2014 Aug 13. Prog Cardiovasc Dis. 2015. PMID: 25559061 Free PMC article. Review.
Cited by
-
Endurance Exercise Ability in the Horse: A Trait with Complex Polygenic Determinism.Front Genet. 2017 Jun 28;8:89. doi: 10.3389/fgene.2017.00089. eCollection 2017. Front Genet. 2017. PMID: 28702049 Free PMC article.
-
Omics-driven investigation of the biology underlying intrinsic submaximal working capacity and its trainability.Physiol Genomics. 2023 Nov 1;55(11):517-543. doi: 10.1152/physiolgenomics.00163.2022. Epub 2023 Sep 4. Physiol Genomics. 2023. PMID: 37661925 Free PMC article.
-
Exercise Capacity and Response to Training Quantitative Trait Loci in a NZW X 129S1 Intercross and Combined Cross Analysis of Inbred Mouse Strains.PLoS One. 2015 Dec 28;10(12):e0145741. doi: 10.1371/journal.pone.0145741. eCollection 2015. PLoS One. 2015. PMID: 26710100 Free PMC article.
-
Advances in exercise, fitness, and performance genomics in 2012.Med Sci Sports Exerc. 2013 May;45(5):824-31. doi: 10.1249/MSS.0b013e31828b28a3. Med Sci Sports Exerc. 2013. PMID: 23470294 Free PMC article. Review.
-
Genetic polymorphisms to predict gains in maximal O2 uptake and knee peak torque after a high intensity training program in humans.Eur J Appl Physiol. 2016 May;116(5):947-57. doi: 10.1007/s00421-016-3353-7. Epub 2016 Mar 21. Eur J Appl Physiol. 2016. PMID: 27001664
References
-
- Abecasis GR, Cherny SS, Cookson WO, Cardon LR. Merlin-rapid analysis of dense genetic maps using sparse gene flow trees. Nat Genet. 2002;30:97–101. - PubMed
-
- Anney RJ, Lasky-Su J, O'Dushlaine C, Kenny E, Neale BM, Mulligan A, Franke B, Zhou K, Chen W, Christiansen H, Arias-Vasquez A, Banaschewski T, Buitelaar J, Ebstein R, Miranda A, Mulas F, Oades RD, Roeyers H, Rothenberger A, Sergeant J, Sonuga-Barke E, Steinhausen H, Asherson P, Faraone SV, Gill M. Conduct disorder and ADHD: evaluation of conduct problems as a categorical and quantitative trait in the international multicentre ADHD genetics study. Am J Med Genet B Neuropsychiatr Genet. 2008;147B:1369–1378. - PubMed
-
- Barresi R, Moore SA, Stolle CA, Mendell JR, Campbell KP. Expression of gamma–sarcoglycan in smooth muscle and its interaction with the smooth muscle sarcoglycan-sarcospan complex. J Biol Chem. 2000;275:38554–38560. - PubMed
-
- Barrett JC, Fry B, Maller J, Daly MJ. Haploview: analysis and visualization of LD and haplotype maps. Bioinformatics. 2005;21:263–265. - PubMed
Publication types
MeSH terms
Grants and funding
LinkOut - more resources
Full Text Sources
Miscellaneous
