. 2012 Feb 10;287(7):4552-61.
doi: 10.1074/jbc.M111.315705. Epub 2011 Dec 13.

Glutathione degradation is a key determinant of glutathione homeostasis

Affiliations

Glutathione degradation is a key determinant of glutathione homeostasis

Peggy Baudouin-Cornu et al. J Biol Chem. .

Abstract

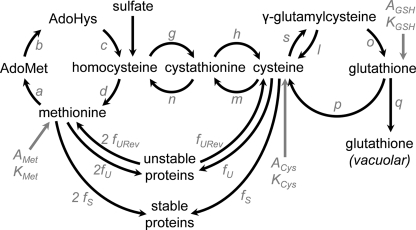
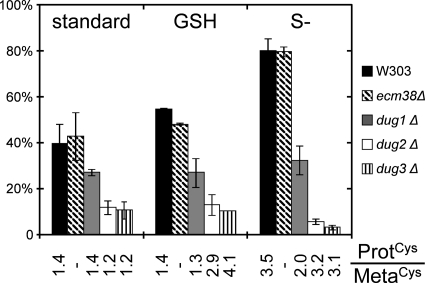
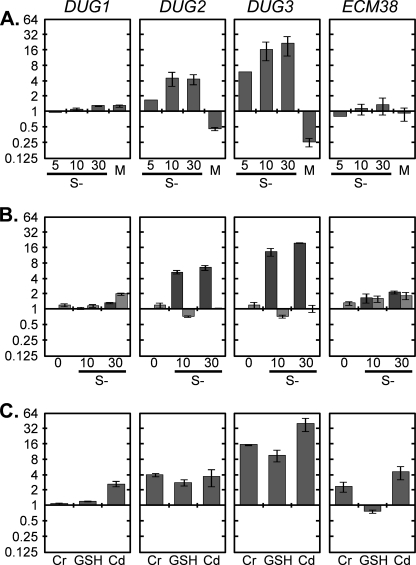
Glutathione (GSH) has several important functions in eukaryotic cells, and its intracellular concentration is tightly controlled. Combining mathematical models and (35)S labeling, we analyzed Saccharomyces cerevisiae sulfur metabolism. This led us to the observation that GSH recycling is markedly faster than previously estimated. We set up additional in vivo assays and concluded that under standard conditions, GSH half-life is around 90 min. Sulfur starvation and growth with GSH as the sole sulfur source strongly increase GSH degradation, whereas cadmium (Cd(2+)) treatment inhibits GSH degradation. Whatever the condition tested, GSH is degraded by the cytosolic Dug complex (composed of the three subunits Dug1, Dug2, and Dug3) but not by the γ-glutamyl-transpeptidase, raising the question of the role of this enzyme. In vivo, both DUG2/3 mRNA levels and Dug activity are quickly induced by sulfur deprivation in a Met4-dependent manner. This suggests that Dug activity is mainly regulated at the transcriptional level. Finally, analysis of dug2Δ and dug3Δ mutant cells shows that GSH degradation activity strongly impacts on GSH intracellular concentration and that GSH intracellular concentration does not affect GSH synthesis rate. Altogether, our data led us to reconsider important aspects of GSH metabolism, challenging notions on GSH synthesis and GSH degradation that were considered as established.


Figures

FIGURE 1.
FIGURE 1.
GSH synthesis and catabolism in yeast cytosol and vacuole. 1, γ-GCS, encoded by GSH1; 2, glutathione synthetase, encoded by GSH2; 3, peptidase complex, encoded by DUG2 and DUG3; 4, Cys-Gly dipeptidase, encoded by DUG1; 5, vacuolar glutathione S-conjugate transporter, encoded by YCF1; 6, γ-GT, encoded by ECM38.
FIGURE 2.
FIGURE 2.
Model used for simulating 35S labeling. Entering of [35S]Met, [35S]Cys and [35S]GSH, used as tracers, are modeled with the parameters (AMet, KMet), (ACys, KCys) and (AGSH, KGSH), respectively (supplemental information, Part 1). Names of the fluxes, expressed in mm·min−1, are indicated near the corresponding arrows. AdoMet is S-adenosylmethionine, AdoHys is S-adenosylhomocysteine. Forward fluxes are the fluxes g, h, s, o, q, d, a, b, fU; reverse fluxes are the fluxes n, m, l, p, c, fURev; fixed' fluxes are the fluxes q and fS (supplemental information, Part 1).
FIGURE 3.
FIGURE 3.
In vivo35S labeling and corresponding simulations. Cells grown under standard conditions were labeled at t = 0 with [35S]Met, [35S]Cys, or [35S]GSH. The same amount of culture was regularly collected and processed to extract MF and PF. A, shown is measured radioactivity in PF and MF when cells are labeled with [35S]Met, [35S]Cys, or [35S]GSH (gray dotted lines) and the corresponding simulation (black line). Measured and simulated values are relative to final total intracellular radioactivity. B, the left panel shows a representative autoradiography of 35S-labeled metabolites separated by TLC in the case of [35S]Met labeling. Time of collection is indicated below each corresponding lane. Arrows indicate [35S]Met, [35S]GSH, and [35S]cystathionine spots. The metabolite indicated with an asterisk is probably S-adenosylmethionine converted into methylthioadenosine during extraction. The right panel shows signals measured for intracellular [35S]Met, [35S]GSH, and [35S]cystathionine using TLC experiments and [35S]Met labeling (gray dotted lines) and corresponding simulations (black line). Maximal values, measured experimentally or simulated, are set to 1.
FIGURE 4.
FIGURE 4.
Determination of GSH apparent half-life (appT1/2GSH). Cells grown under standard conditions were labeled with [35S]GSH for 30–40 min, washed, and suspended either in nonradioactive standard medium or sulfur-free medium. The same amount of culture was regularly collected and processed to extract MF and PF. A, shown is autoradiography (left panel) and the corresponding quantifications (right panel) of the 35S-labeled metabolites separated by TLC. Time of collection (min) is indicated below each lane. The arrow indicates [35S]GSH spots. GSH is the sole radioactive metabolite that is detectable under these conditions. [35S]GSH radioactivity at time 0 is set to 100%. B, shown is evolution of the radioactivity in MF (black diamonds) and PF (asterisks) of representative experiments. Values are relative to total radioactivity.
FIGURE 5.
FIGURE 5.
GSH degradation is impaired in dugΔ mutants. Cells grown under standard conditions were labeled with [35S]GSH for 30–40 min and transferred at t = 0 to nonradioactive standard medium, 0.5 mm GSH medium (GSH), or sulfur-free medium (S−). Cells were collected at t = 0 and t = 1 h (S−) or 2 h (standard, GSH) and processed to extract MF and PF. The percent of the radioactivity initially present in MF then found in PF after 1 or 2 h is represented by histograms. The ratio of radioactivity found in PF and MF (ProtCys/MetaCys) after 10 min labeling with [35S]Cys in the different mutants and conditions is indicated. Error bars represent S.D. of independent experiments (supplemental information, Part 8).
FIGURE 6.
FIGURE 6.
DUG1, DUG2, DUG3, and ECM38 mRNA relative levels in WT and met4Δ strains. In all the quantitative real-time-PCRs experiments, ACT1 was used as the internal standard. Error bars represent the S.D. of two independent experiments. A, shown is -fold induction after 5, 10, or 30 min in sulfur-free medium (S−) or after supplementation with 0.5 mm Met (M) for 1 h relative to cells grown under standard conditions. B, -fold induction 0, 10, or 30 min after transfer from 50 μm Met-containing medium to sulfur-free medium in WT (dark gray) or met4Δ (light gray) strains relative to the WT strain grown with 50 μm Met as unique sulfur source. C, shown is -fold induction after 30 min of treatment with chromate (Cr, 10 μm), 1 h of growth in 0.5 mm GSH as unique sulfur source, or 1 h of treatment with Cd2+ (5 μm) relative to cells grown under standard conditions.
FIGURE 7.
FIGURE 7.
GSH degradation is impaired in met4Δ mutants during sulfur starvation. WT and met4Δ cells grown with 50 μm Met as unique sulfur source were labeled with [35S]GSH for 40 min and transferred to sulfur-free medium, and the proportion of 35S incorporated in proteins was measured after different incubation times. Error bars represent the S.D. of two independent experiments.

References

    1. Ballatori N., Krance S. M., Notenboom S., Shi S., Tieu K., Hammond C. L. (2009) Glutathione dysregulation and the etiology and progression of human diseases. Biol. Chem. 390, 191–214 - PMC - PubMed
    1. Lu S. C. (1999) Regulation of hepatic glutathione synthesis. Current concepts and controversies. FASEB J. 13, 1169–1183 - PubMed
    1. Lu S. C. (2009) Regulation of glutathione synthesis. Mol. Aspects Med. 30, 42–59 - PMC - PubMed
    1. Bourbouloux A., Shahi P., Chakladar A., Delrot S., Bachhawat A. K. (2000) Hgt1p, a high affinity glutathione transporter from the yeast Saccharomyces cerevisiae. J. Biol. Chem. 275, 13259–13265 - PubMed
    1. Rebbeor J. F., Connolly G. C., Dumont M. E., Ballatori N. (1998) ATP-dependent transport of reduced glutathione on YCF1, the yeast orthologue of mammalian multidrug resistance- associated proteins. J. Biol. Chem. 273, 33449–33454 - PubMed

Publication types

MeSH terms

LinkOut - more resources