. 2012 Feb 24;287(9):6503-17.
doi: 10.1074/jbc.M111.309138. Epub 2011 Dec 14.

Cytosolic carboxypeptidase 1 is involved in processing α- and β-tubulin

Affiliations

Cytosolic carboxypeptidase 1 is involved in processing α- and β-tubulin

Iryna Berezniuk et al. J Biol Chem. .

Abstract

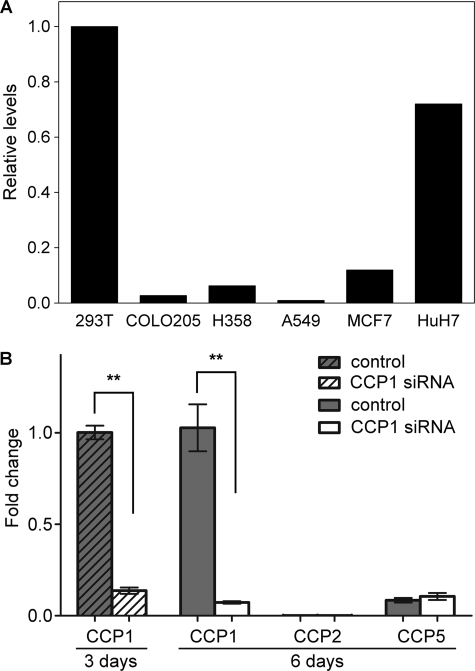
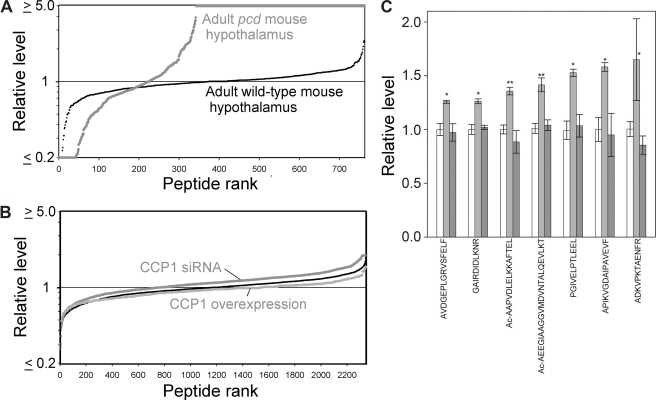
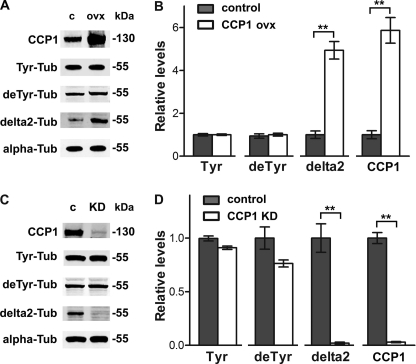
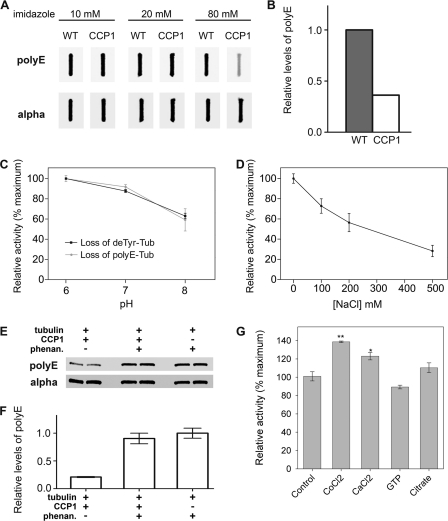
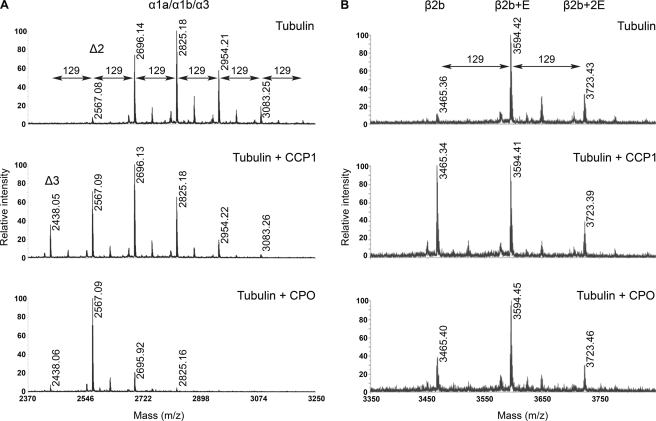
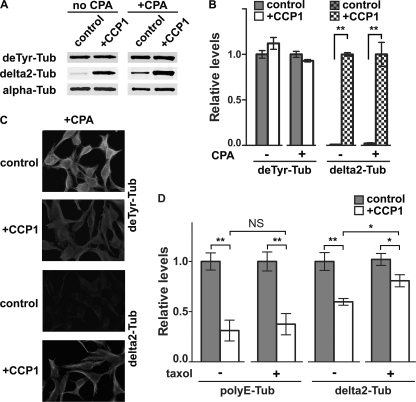
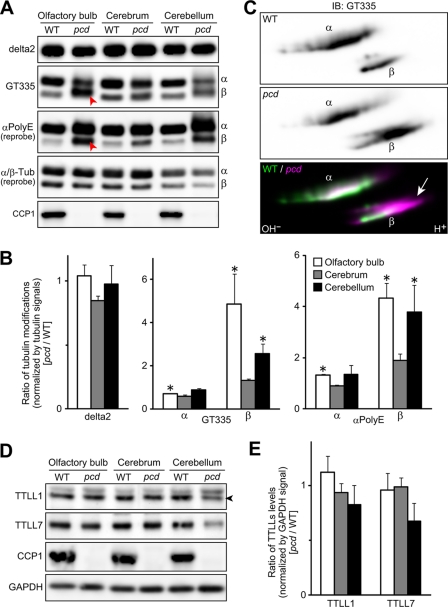
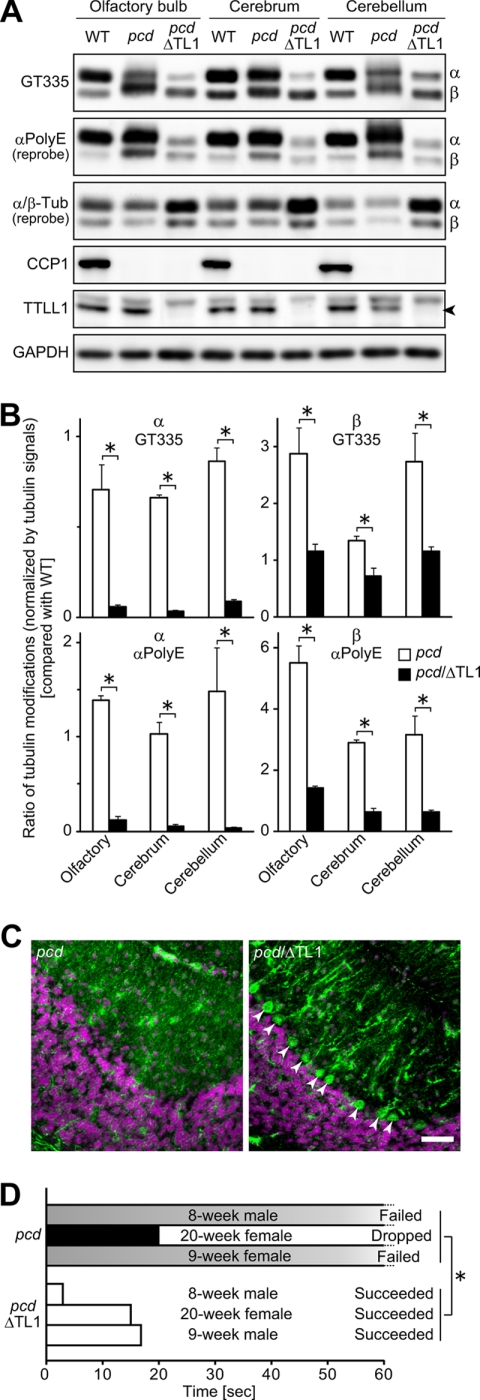
The Purkinje cell degeneration (pcd) mouse has a disruption in the gene encoding cytosolic carboxypeptidase 1 (CCP1). This study tested two proposed functions of CCP1: degradation of intracellular peptides and processing of tubulin. Overexpression (2-3-fold) or knockdown (80-90%) of CCP1 in human embryonic kidney 293T cells (HEK293T) did not affect the levels of most intracellular peptides but altered the levels of α-tubulin lacking two C-terminal amino acids (delta2-tubulin) ≥ 5-fold, suggesting that tubulin processing is the primary function of CCP1, not peptide degradation. Purified CCP1 produced delta2-tubulin from purified porcine brain α-tubulin or polymerized HEK293T microtubules. In addition, CCP1 removed Glu residues from the polyglutamyl side chains of porcine brain α- and β-tubulin and also generated a form of α-tubulin with two C-terminal Glu residues removed (delta3-tubulin). Consistent with this, pcd mouse brain showed hyperglutamylation of both α- and β-tubulin. The hyperglutamylation of α- and β-tubulin and subsequent death of Purkinje cells in pcd mice was counteracted by the knock-out of the gene encoding tubulin tyrosine ligase-like-1, indicating that this enzyme hyperglutamylates α- and β-tubulin. Taken together, these results demonstrate a role for CCP1 in the processing of Glu residues from β- as well as α-tubulin in vitro and in vivo.


Figures

FIGURE 1.
FIGURE 1.
High abundance of CCP1 mRNA in HEK293T cells and the specificity of CCP1 knockdown. A, quantitative real time PCR was performed to determine CCP1 mRNA levels in HEK293T, COLO205, H358, A549, MCF7, and HuH7 human cell lines. The highest relative levels of CCP1 mRNA were observed in HEK293T cells. B, quantitative real time PCR was performed to determine mRNA levels of CCP1–6 in HEK293T cells after treatment with control dsRNA or CCP1 siRNA for 3 or 6 days, as indicated. For the 3-day treatment, only data for CCP1 are shown. For both time points, CCP3, CCP4, and CCP6 mRNAs were not detectable (data not shown). Treatment of cells with CCP1 siRNA for either 3 or 6 days leads to a significant decrease of CCP1 mRNA but does not affect mRNA levels of other CCPs. Fold change in expression was calculated using the ΔΔCt method. GAPDH was used as an internal control. n = 4. Error bars represent means ± S.E. **, p < 0.01 using Student's t test.
FIGURE 2.
FIGURE 2.
Effect of CCP1 on peptide levels in HEK293T cells and WT and pcd mice. Quantitative peptidomics was used to analyze the levels of peptides derived from cytosolic and mitochondrial proteins. A, relative levels of peptides in the hypothalamus of adult WT and pcd mice. Each dot in the graph represents the ratio of a peptide in one replicate of the indicated group versus the average level in the WT replicates. Small black circles show the WT/WT ratio; larger gray circles represent the pcd/WT ratio. The y axis is logarithmic and is capped at either 5-fold decreases (ratio ≤0.2) or increases (ratio ≥5). The x axis represents the relative rank order of each peptide, compared with all other peptides detected in the study. B, relative levels of peptides in control HEK293T cells, in cells overexpressing CCP1, and in siRNA-treated HEK293T cells. Each dot in the graph represents the relative level of an individual peptide in one replicate of the indicated group versus the average level of that peptide in the control groups for that experiment. The thin black line (i.e. the small black circles) shows the control/control ratio, the lower light gray line shows the ratio for CCP1 overexpression/control; and the upper dark gray line shows the ratio for CCP1 siRNA/control. C, effect of CCP1 knockdown or overexpression on the level of individual peptides. Levels of peptides detected by peptidomics of HEK293T cells after CCP1 knockdown and overexpression were analyzed and compared with controls pooled from both experiments. Graph shows the relative levels of those peptides that showed statistically significant changes after CCP1 knockdown for 3 days compared with controls. VVRHQLLKT is derived from cytochrome c oxidase subunit 7c; AVDEPLGRVSFELF, KHTGPGILSM, and ADKVPKTAENFRAL from peptidylprolyl isomerase A; GAIRDIDLKNR from splicing factor, arginine/serine-rich 1; MTEEAAVAIKAMAK from eukaryotic translation initiation factor 5A; Ac-AAPVDLELKKAFTEL from prefoldin subunit 1; Ac-AEEGIAAGGVMDVNTALQEVLKT from of 40 S ribosomal protein S12; PGIVELPTLEEL from NADH dehydrogenase 1α subcomplex, 8; and APIKVGDAIPAVEVF from peroxiredoxin 5. n = 6 for controls, n = 2 for KD/overexpression. *, p ≤ 0.05; **, p ≤ 0.01 versus pooled controls using two-tailed Student's t test.
FIGURE 3.
FIGURE 3.
α-Tubulin processing in HEK293T cells after CCP1 overexpression or knockdown. A, representative Western blots for CCP1 protein and different forms of α-tubulin in HEK293T cells after overexpression of His6-tagged CCP1. B, densitometric analysis of the levels of CCP1 protein and different tubulin forms in control and CCP1-overexpressing HEK293T cells. The Tyr-, deTyr-, and delta2-tubulin band densities were normalized with the corresponding α-tubulin bands. Band densities were measured using the Odyssey infrared imaging system. The levels of delta2-tubulin are significantly increased in HEK293T cells after CCP1 overexpression for 2 days, whereas other tubulin modifications are not affected. Error bars represent mean ± S.E. (n = 4). **, p < 0.01 using Student's t test. C, representative Western blots for CCP1 protein and different forms of α-tubulin after treatment of cells with CCP1 siRNA for 3 days. D, densitometric analysis of the levels of CCP1 protein and different tubulin forms in control and siRNA-treated HEK293T cells. The Tyr-, deTyr-, and delta2-tubulin band densities were normalized with the corresponding α-tubulin bands. The levels of delta2-tubulin are significantly decreased in HEK293T cells after CCP1 mRNA knock down for 3 days. Error bars represent mean ± S.E. (n = 4). **, p < 0.01 using Student's t test. Abbreviations used are as follows: c, control; KD, knockdown; ovx, overexpression; Tub, tubulin.
FIGURE 4.
FIGURE 4.
Characterization of CCP1 enzymatic activity toward purified brain tubulin. A, Sf9 cells infected with either wild-type (WT) baculovirus or CCP1-expressing baculovirus were eluted from a metal affinity column with buffers containing 10, 20, or 80 mm imidazole. The eluates were incubated with purified porcine brain tubulin at 37 °C for 2 h. After incubation, samples were slot-blotted into the nitrocellulose membrane and probed with either polyE or α-tubulin antibody. B, densitometric analysis of polyE-tubulin levels after treatment with 80 mm eluates from either the WT virus or CCP1-expressing virus. The polyE-tubulin band densities were normalized with the corresponding α-tubulin bands. Although the initial screening of the column fractions was performed a single time, the 80 mm imidazole eluate from the CCP1-expressing virus was used for the subsequent studies in this figure, each of which was performed in replicates. C, effect of pH on CCP1 activity toward porcine brain tubulin. Purified CCP1 was incubated with purified tubulin (Tub) at different pH values for 1 h, and then samples were slot-blotted into nitrocellulose membrane and probed with deTyr- (n = 3) and polyE-tubulin antibodies (n = 6). Error bars represent means ± S.E.. D, effect of NaCl on CCP1 activity toward porcine brain tubulin. Purified CCP1 was incubated with purified tubulin at pH 7 for 1 h at different concentrations of NaCl. Samples were slot-blotted onto nitrocellulose membrane, and CCP1 activity was measured as loss of polyE-tubulin. Error bars represent means ± S.E. (n = 3). E and F, purified CCP1 was incubated with purified brain tubulin at pH 7 for 1 h in the presence or absence of 10 mm o-phenanthroline (phenan). E, representative Western blots for polyE and α-tubulin. F, densitometric analysis of levels of polyE-tubulin (n = 2). The band densities were normalized with the corresponding α-tubulin bands. G, purified CCP1 was incubated with purified tubulin at pH 7 for 1 h in the presence of 1 mm CoCl2, CaCl2, GTP, or citrate. Samples were blotted into nitrocellulose membrane and CCP1 activity was measured as loss of polyE-tubulin. Error bars represent means ± S.E. (n = 3). *, p < 0.05; **, p < 0.01 versus control, using Student's t test.
FIGURE 5.
FIGURE 5.
Tubulin processing by purified CCP1. A, representative spectra of α1a/α1b/α3 forms of porcine α-tubulin. After incubation, tubulin was isolated on polyacrylamide gel, digested with CNBr, and analyzed as described. The form shown is the C-terminal region of α1a/α1b/α3. Top panel, spectrum of α1a/α1b/α3 brain tubulin alone. Middle panel, spectrum of α1a/α1b/α3 brain tubulin after incubation with purified CCP1. Bottom panel, spectrum of α1a/α1b/α3 brain tubulin after incubation with CPO. B, representative spectra of β2b form of porcine β-tubulin. After incubation, tubulin was isolated on a polyacrylamide gel, digested with CNBr, and analyzed as described. The form shown is the C-terminal region of β2b. Top panel, spectrum of β2b brain tubulin alone. Middle panel, spectrum of β2b brain tubulin after incubation with purified CCP1. Bottom panel, spectrum of β2b brain tubulin after incubation with CPO. The molecular mass of a Glu residue is 129 Da.
FIGURE 6.
FIGURE 6.
CCP1 activity toward polymerized tubulin. HEK293T cells were treated on plates with microtubule-stabilizing buffer containing 5 μm taxol, and then half of the plates were treated with CPA1 (40 ng/ml) to convert Tyr-tubulin into deTyr-tubulin. After intensive washes to remove the CPA1, polymerized microtubules were treated with purified CCP1 for 1 h and then processed for either Western blot or immunostaining. A, representative Western blots for different forms of α-tubulin after treatment of microtubules with purified CCP1. B, densitometric analysis of different tubulin forms after treatment of polymerized microtubules with purified CCP1. The deTyr- and delta2-tubulin band densities were normalized with the corresponding α-tubulin bands. The levels of delta2-tubulin are significantly increased after CCP1 treatment, whereas other forms of tubulin are not affected. Error bars represent means ± S.E. (n = 4). **, p < 0.01 versus control using Student's t test. C, immunofluorescence analysis of polymerized microtubules after treatment with CPA1 and then with CCP1. Polymerized control or CCP1-treated microtubules were subjected to immunostaining with antisera against deTyr- and delta2-tubulin. D, purified brain tubulin was incubated with CCP1 in the presence or absence of 5 μm taxol. Samples were processed for Western blot, and densitometric analysis of polyE and delta2-tubulin forms was performed. The levels of polyE and delta2-tubulin significantly decreased after CCP1 treatment in either the absence (−) or presence (+) of taxol. *, p < 0.05; **, p < 0.01 using Student's t test. NS, not significant. Tub, tubulin.
FIGURE 7.
FIGURE 7.
Hyperglutamylation of β-tubulin as well as α-tubulin in adult pcd brain. A, representative Western blots for glutamylated α- and β-tubulins and CCP1. Glutamylated or polyglutamylated tubulin (Tub) was detected with GT335 or αpolyE, respectively. Arrowheads highlight increases of β-tubulin band intensities detected by GT335 and αpolyE in olfactory bulb. α- and β-tubulins were detected with independent antibodies, and so the relative intensities of the two forms do not appear identical. B, quantitative analysis of tubulin modifications in the pcd brain. Results are shown as mean of data with three independent animals. Error bars represent means ± S.E. (n = 3). *, p < 0.05 using Student's t test. C, Western blots of two-dimensionally separated α- and β-tubulins of olfactory bulb samples. Note that β-tubulin of pcd olfactory bulb migrated to highly acidic region (arrow). α-Tubulin also shifted to the acidic region. IB, immunoblot. D, levels of TTLL1 and TTLL7 were examined by Western blot analysis of pcd and WT mouse brain regions. GAPDH was detected as loading control. An arrowhead points to the bands of TTLL1. E, quantitative analysis of TTL-like proteins levels in the pcd brain. Results are shown as mean of data with three independent animals. Error bars represent means ± S.E. (n = 3). No significant difference was detected with Student's t test (p > 0.05). Panels A–E used mice that were ∼2 months old.
FIGURE 8.
FIGURE 8.
Reduction of hyperpolyglutamylation of β-tubulin as well as α-tubulin in the pcd/ttll1KO brain. A, representative Western blots for glutamylated and polyglutamylated α- and β-tubulins, CCP1, TTLL1, and GAPDH using ∼2 month old mouse brain extracts. Signal intensities of polyglutamylated β-tubulin detected with αpolyE reached the same level as WT samples in the pcd/TTLL1-knock-out double mutant samples (pcd/ΔTL1). The band of β-tubulin detected with GT335 and αpolyE migrated to the same position as the WT band in the pcd/ΔTL1 samples. Glutamylated and polyglutamylated α-tubulin were grossly decreased in pcd/ΔTL1 samples. α- and β-tubulins were detected with independent antibodies, and so the relative intensities of the two forms do not appear identical. Arrowhead indicates the position of TTLL1. B, quantitative analysis of tubulin modifications in the pcd or pcd/ΔTL1 brain. Results are shown as mean of data with three independent animals. Error bars represent means ± S.E. (n = 3). *, p < 0.05 using Student's t test. C, immunohistochemical analysis of a cerebellum thin section. Neurons were labeled with anti-MAP1A. Nuclei were labeled with 4′,6-diamidino-2-phenylindole. In the pcd/ΔTL1 cerebellum, a number of Purkinje cells were observed (arrowheads). Scale bar, 50 μm. Three independent animals were examined for each genotype. D, behavioral test. Three animals of each genotype were analyzed. All pcd/ΔTL1 mice succeeded in the test within 20 s. In contrast, none of the pcd mice passed the test; they either failed to climb within 60 s (failed) or dropped from the cord (dropped). *, p < 0.05 using Student's t test with dropped data regarded as 60-s failure. Movies of representative mice are included in the supplemental information.

References

    1. Harris A., Morgan J. I., Pecot M., Soumare A., Osborne A., Soares H. D. (2000) Regenerating motor neurons express Nna1, a novel ATP/GTP-binding protein related to zinc carboxypeptidases. Mol. Cell. Neurosci. 16, 578–596 - PubMed
    1. Kalinina E., Biswas R., Berezniuk I., Hermoso A., Aviles F. X., Fricker L. D. (2007) A novel subfamily of mouse cytosolic carboxypeptidases. FASEB J. 21, 836–850 - PubMed
    1. Rodriguez de la Vega M., Sevilla R. G., Hermoso A., Lorenzo J., Tanco S., Diez A., Fricker L. D., Bautista J. M., Avilés F. X. (2007) Nna1-like proteins are active metallocarboxypeptidases of a new and diverse M14 subfamily. FASEB J. 21, 851–865 - PubMed
    1. Fernandez-Gonzalez A., La Spada A. R., Treadaway J., Higdon J. C., Harris B. S., Sidman R. L., Morgan J. I., Zuo J. (2002) Purkinje cell degeneration (pcd) phenotypes caused by mutations in the axotomy-induced gene, Nna1. Science 295, 1904–1906 - PubMed
    1. Mullen R. J., Eicher E. M., Sidman R. L. (1976) Purkinje cell degeneration, a new neurological mutation in the mouse. Proc. Natl. Acad. Sci. U.S.A. 73, 208–212 - PMC - PubMed

Publication types

MeSH terms