Demographic, dietary, and biochemical determinants of vitamin D status in inner-city children
- PMID: 22170368
- PMCID: PMC3238457
- DOI: 10.3945/ajcn.111.018721
Demographic, dietary, and biochemical determinants of vitamin D status in inner-city children
Abstract
Background: Reports of clinical rickets are particularly evident in minority infants and children, but only limited analyses of vitamin D are available in this demographic group.
Objective: We sought to characterize circulating 25-hydroxyvitamin D [25(OH)D], 1,25-dihydroxyvitamin D [1,25(OH)(2)D], and their determinants, including circulating parathyroid hormone (PTH), total alkaline phosphatase activity (ALP), calcium, and phosphorus, in minority infants and children.
Design: We obtained demographic information and blood samples for measurement of PTH, ALP, 25(OH)D, and 1,25(OH)(2)D in >750 6-mo- to 3-y-old children. Dietary intake data were obtained and analyzed.
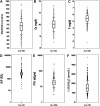
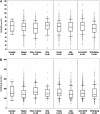
Results: The mean (±SD) 25(OH)D concentration was 66 ± 22 nmol/L (26.3 ± 8.7 ng/dL). A total of 15% of children had 25(OH)D concentrations less than the recommended target threshold of 50 nmol/L. Combined elevations of PTH and ALP occurred in only 2.5% of children. Determinants of 25(OH)D included vitamin D intake, age (decreasing with age), skin type (greater concentrations in lighter-skinned children than in darker-skinned children), formula use (higher intakes), season (greater concentrations in the summer and fall than in the winter and spring), and, inversely, PTH. The mean 1,25(OH)(2)D concentration was 158 ± 58 pmol/L (60.6 ± 22.5 pg/mL), which was consistent with a reference range of 41-274 pmol/L or 15.7-105.5 pg/mL. Determinants for 1,25(OH)(2)D were age (decreasing with age), sex (greater concentrations in girls than in boys), skin type (greater concentrations in lighter-skinned children than in darker-skinned children), and, inversely, serum calcium and phosphorus.
Conclusions: Although 15% of subjects were vitamin D insufficient, only 2.5% of subjects had elevations of both PTH and ALP. The greater 25(OH)D concentrations observed with formula use confirm that dietary vitamin D fortification is effective in this demographic group. Circulating 1,25(OH)(2)D is higher in infants than in older children and adults and, in contrast to 25(OH)D, is not directly correlated with nutrient intakes.
Figures


Similar articles
-
Interactions between Vitamin D Status, Calcium Intake and Parathyroid Hormone Concentrations in Healthy White-Skinned Pregnant Women at Northern Latitude.Nutrients. 2018 Jul 17;10(7):916. doi: 10.3390/nu10070916. Nutrients. 2018. PMID: 30018262 Free PMC article.
-
Vitamin D status of children in Kerala, southern India.Public Health Nutr. 2020 May;23(7):1179-1183. doi: 10.1017/S1368980018003622. Epub 2019 Jan 10. Public Health Nutr. 2020. PMID: 30628561 Free PMC article.
-
Optimal level of 25-(OH)D in children in Nanjing (32°N Lat) during winter.Pediatr Int. 2011 Aug;53(4):541-5. doi: 10.1111/j.1442-200X.2010.03309.x. Pediatr Int. 2011. PMID: 21159027
-
Vitamin D biomarkers for Dietary Reference Intake development in children: a systematic review and meta-analysis.Am J Clin Nutr. 2022 Feb 9;115(2):544-558. doi: 10.1093/ajcn/nqab357. Am J Clin Nutr. 2022. PMID: 34687199
-
Racial/ethnic considerations in making recommendations for vitamin D for adult and elderly men and women.Am J Clin Nutr. 2004 Dec;80(Suppl 6):1763S-6S. doi: 10.1093/ajcn/80.6.1763S. Am J Clin Nutr. 2004. PMID: 15585802 Review.
Cited by
-
25-OHD response to vitamin D supplementation in children: effect of dose but not GC haplotype.Eur J Endocrinol. 2021 Jul 7;185(2):333-342. doi: 10.1530/EJE-21-0349. Eur J Endocrinol. 2021. PMID: 34128826 Free PMC article. Clinical Trial.
-
Vitamin D Levels in Malnourished Children under 5 Years in a Tertiary Care Center at Muhimbili National Hospital, Dar es Salaam, Tanzania-A Cross-sectional Study.J Trop Pediatr. 2017 Jun 1;63(3):203-209. doi: 10.1093/tropej/fmw081. J Trop Pediatr. 2017. PMID: 27794532 Free PMC article.
-
Non-Western immigrant children have lower 25-hydroxyvitamin D than children from Western families.Public Health Nutr. 2014 Jul;17(7):1547-54. doi: 10.1017/S1368980013001328. Epub 2013 May 24. Public Health Nutr. 2014. PMID: 23701731 Free PMC article.
-
Tobacco smoke exposure is an independent predictor of vitamin D deficiency in US children.PLoS One. 2018 Oct 8;13(10):e0205342. doi: 10.1371/journal.pone.0205342. eCollection 2018. PLoS One. 2018. PMID: 30296288 Free PMC article.
-
Nutrient Status of Vitamin D among Chinese Children.Nutrients. 2017 Mar 23;9(4):319. doi: 10.3390/nu9040319. Nutrients. 2017. PMID: 28333101 Free PMC article.
References
-
- Willis CM, Laing EM, Hall DB, Hausman DB, Lewis RD. A prospective analysis of plasma 25-hydroxyvitamin D concentrations in white and black prepubertal females in the southeastern United States. Am J Clin Nutr 2007;85:124–30 - PubMed
-
- Stein EM, Laing EM, Hall DB, Hausman DB, Kimlin MG, Johnson MA, Modlesky CM, Wilson AR, Lewis RD. Serum 25-hydroxyvitamin D concentrations in girls aged 4-8 y living in the southeastern United States. Am J Clin Nutr 2006;83:75–81 - PubMed
-
- Gordon CM, DePeter KC, Feldman HA, Grace E, Emans SJ. Prevalence of vitamin D deficiency among healthy adolescents. Arch Pediatr Adolesc Med 2004;158:531–7 - PubMed
Publication types
MeSH terms
Substances
Grants and funding
LinkOut - more resources
Full Text Sources
Medical

