. 2011 Dec 14;31(50):18251-65.
doi: 10.1523/JNEUROSCI.4164-11.2011.

Vesicular zinc regulates the Ca2+ sensitivity of a subpopulation of presynaptic vesicles at hippocampal mossy fiber terminals

Affiliations

Vesicular zinc regulates the Ca2+ sensitivity of a subpopulation of presynaptic vesicles at hippocampal mossy fiber terminals

Nathalie Lavoie et al. J Neurosci. .

Abstract

Synaptic vesicles segregate into functionally diverse subpopulations within presynaptic terminals, yet there is no information about how this may occur. Here we demonstrate that a distinct subgroup of vesicles within individual glutamatergic, mossy fiber terminals contain vesicular zinc that is critical for the rapid release of a subgroup of synaptic vesicles during increased activity in mice. In particular, vesicular zinc dictates the Ca(2+) sensitivity of release during high-frequency firing. Intense synaptic activity alters the subcellular distribution of zinc in presynaptic terminals and decreases the number of zinc-containing vesicles. Zinc staining also appears in endosomes, an observation that is consistent with the preferential replenishment of zinc-enriched vesicles by bulk endocytosis. We propose that functionally diverse vesicle pools with unique membrane protein composition support different modes of transmission and are generated via distinct recycling pathways.


Figures
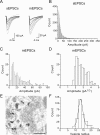
Figure 1.
Figure 1.
mEPSC amplitude distribution of CA3 pyramidal cell does not solely depend on vesicle size in MF boutons. A, Example traces of sEPSCs and mEPSCs recorded from control WT mice. B, C, sEPSC amplitude distribution (3500 events; n = 14) and mEPSCs (303 events from 1 representative cell) display a rightward skew. D, Amplitude distribution of the cube-rooted data shown in C. E, Micrograph represents MF bouton from CA3 stratum lucidum. F, The distribution of vesicles size can be fitted with a single Gaussian function (255 vesicles; 10 boutons). Scale bar, 0.5 μm.
Figure 2.
Figure 2.
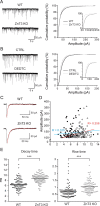
Vesicular zinc selectively influences sEPSCs of CA3 pyramidal cells. sEPSCs recorded in CA3 pyramidal cells from ZnT3 WT and KO mice. Synaptic activity was also recorded from ZnT3 WT mice after 15 min application of 200 μm DEDTC. A, Control traces of EPSCs from WT and KO mice. Cumulative probability plot of sEPSC amplitude (n = 14 cells; 250 events per cell; p < 0.00001). Inset, Amplitude distribution of the larger events (last 10%). B, EPSCs in the presence of DEDTC. Cumulative probability plot of sEPSC amplitude (n = 8 cells; 250 events per cell; p < 0.001). Inset, Amplitude distribution of the larger events (last 10%). C, Example traces of sEPSCs and their decay fit (red traces). D, sEPSC amplitude (>100 pA) for WT (black circles) and KO (white circles) are plotted as a function of their decay kinetics. Data were fit for linear correlation (WT, blue; KO, red). E, Scatter plots represent decay tau and rise time (20–80%) of 106 events (n = 7). Lines correspond to variable mean. Paired Student's t tests were performed (***p < 0.001). CTRL, Control.
Figure 3.
Figure 3.
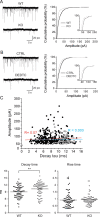
Vesicular zinc influences mEPSCs of CA3 pyramidal cells. mEPSCs recorded in CA3 pyramidal cells from ZnT3 WT and KO mice. Synaptic activity was also recorded from ZnT3 WT mice after 15 min application of 200 μm DEDTC. A, EPSCs recorded from WT and KO mice in ACSF with 1 μm TTX. Cumulative probability plot of mEPSC amplitude (n = 10 cells; 50 events per cell; p < 0.00001). Inset, Amplitude distribution of the larger events (last 10%). B, EPSCs recorded with DEDTC applied to bath solution. Cumulative probability plot of mEPSCs amplitude (n = 8 cells; 50 events per cell; p < 0.001). Inset, Amplitude distribution of the larger events (last 10%). C, mEPSC amplitude of WT (black circles) and KO (white circles) are plotted as a function of their decay kinetics. Data were fit for linear correlation (WT, blue; KO, red). Scatter plots represent decay tau and rise time (20–80%) of 74 events (n = 5 per genotype). Lines correspond to variable mean. Paired Student's t tests were performed (**p < 0.01). CTRL, Control.
Figure 4.
Figure 4.
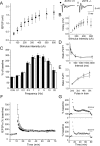
Absence of vesicular zinc does not affect MF short-term or long-term plasticity. A, B, fEPSPs (A) and fiber volley (B) amplitude are plotted as a function of stimulus intensity. Representative traces show fiber volley and fEPSPs of WT (black circles) and KO (white circles). C, KO mice show the same facilitation capacity at different frequencies. The stimulus frequency was increased from 0.05 to 20 Hz with 20 pulses per frequency. fEPSP amplitude was normalized to baseline (0.05 Hz). The last five pulses were averaged for each frequency. D, Paired-pulse facilitation is not affected by the absence of zinc. Two stimuli were applied at different interval. The responses from WT and KO were not significantly different (n = 7 and 5, respectively). E, A train of five pulses at 25 Hz was delivered to the stimulus electrode. There is no significant difference for any of the pulse (n = 7). F, The normalized MF fEPSP amplitude is plotted against time. HFS was applied to the stimulus electrode after 10 min (WT, n = 8; KO, n = 7). G, Representative experiment for ZnT3 WT and KO mice. DCG-IV (1 μm) was applied at least 60 min after LTP induction.
Figure 5.
Figure 5.
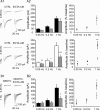
ZnT3 KO mice show selective sensitivity to EGTA-AM. A1, MF EPSCs were evoked at various frequencies in control ACSF and in the presence of EGTA-AM (100 μm). A2, Histograms represent the average amplitude of all cells for WT (black; n = 8) and KO (white; n = 9) mice in control condition and after bath-applied EGTA-AM (stippled bars). Each cell value represents the average of the last 10 sweeps at all frequencies. Scatter plots represent facilitation in control (black) condition and after EGTA-AM treatment (open gray). Evoked EPSCs amplitude was normalized to control baseline (0.05 Hz). B1, MF EPSCs were evoked at various frequencies in ACSF with 200 μm DEDTC and in the presence of EGTA-AM (100 μm). B2, Histogram represents the average amplitude of all cells (black bars, WT slices treated with DEDTC; stippled, EGTA-AM: n = 7). Each cell value represents the average of the last 10 sweeps at all frequencies. Scatter plots represent facilitation in control (black) condition and after EGTA-AM treatment (open gray). Evoked EPSCs amplitude was normalized to baseline (DEDTC, 0.05 Hz). Paired Student's t tests (picoamperes) and one-sample t tests (percentage facilitation) were performed (*p < 0.05, **p < 0.01, ***p < 0.001). CTRL, Control.
Figure 6.
Figure 6.
Decay kinetics of ZnT3 KO mice are different from their WT littermates. A1, Averaged sweeps of MF EPSCs evoked at various frequencies in control ACSF. Responses at 0.2 Hz (blue traces) and 1 Hz (red traces) were scaled to 0.05 Hz baseline value (black traces). A2, Decay kinetics of evoked EPSCs recorded from WT (n = 7) and KO (n = 9) mice could be fitted with a single or double exponentials. A3, EGTA-AM changes the decay kinetics by decreasing the occurrence of the slower component for both genotypes (n = 7). B, Average values of the decay kinetics for WT and KO in control condition and after application of EGTA-AM. CTRL, Control.
Figure 7.
Figure 7.
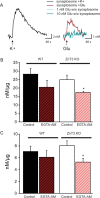
Slow calcium chelator EGTA-AM decreases glutamate release from KO MFSs. A, Samples of six averaged sweeps of continuous monitoring of glutamate (Glu) release elicited from MFS by KCl (25 mm) depolarization or glutamate (20 pm). Control recordings for the luminometric detection of glutamate were performed with 1 and 10 nm glutamate in a physiological medium without synaptosomes. B, C, Amount of glutamate released (nanomolar per micrograms of protein) during KCl (B) or glutamate (C) stimulation. EGTA-AM significantly reduced the amount of glutamate release in KO MFS for both stimulation protocols. Paired Student's t tests were performed (*p < 0.05).
Figure 8.
Figure 8.
Only a subpopulation of vesicles contains zinc. A, Various development times were used during the electron microscopic–Timm's staining protocol. B, Electron micrograph representative of a 15 min development time. C, The ratio of zinc-positive vesicles was calculated from samples with different development times (6–21 min). Percentage of labeled vesicles remained similar under different staining protocols. Longer development times increased the size of individual granules but not the percentage of labeled vesicles. Scale bar, 0.2 μm.
Figure 9.
Figure 9.
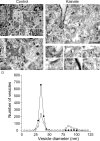
Activity-dependent changes in zinc distribution. A–C, Electron micrographs of MF terminals from control (A, B) and kainic acid-injected ZnT3 WT mice (C). Animals were killed after the second major seizure. Zinc is visualized on these sections with the Timm's method. D, Although the number of zinc-positive vesicles is decreased in kainic acid-injected animals, the number of larger endosome-like structures labeled with zinc increased. (C; arrows, 1–6: endosome-like structures shown on C with higher magnification). Scale bars: A, B, 0.2 μm; C, 2 μm; D, 1 μm; C, 0.5 μm; C, 1–6, 50 nm.

Similar articles

Cited by

References

    1. Acsády L, Kamondi A, Sík A, Freund T, Buzsáki G. GABAergic cells are the major postsynaptic targets of mossy fibers in the rat hippocampus. J Neurosci. 1998;18:3386–3403. - PMC - PubMed
    1. Adler EM, Augustine GJ, Duffy SN, Charlton MP. Alien intracellular calcium chelators attenuate neurotransmitter release at the squid giant synapse. J Neurosci. 1991;11:1496–1507. - PMC - PubMed
    1. Amaral DG, Witter MP. The three-dimensional organization of the hippocampal formation: a review of anatomical data. Neuroscience. 1989;31:571–591. - PubMed
    1. Aravanis AM, Pyle JL, Harata NC, Tsien RW. Imaging single synaptic vesicles undergoing repeated fusion events: kissing, running, and kissing again. Neuropharmacology. 2003;45:797–813. - PubMed
    1. Augustine GJ. How does calcium trigger neurotransmitter release? Curr Opin Neurobiol. 2001;11:320–326. - PubMed

Publication types

MeSH terms