. 2011 Dec 14;31(50):18313-26.
doi: 10.1523/JNEUROSCI.0990-11.2011.

Intrinsic reference frames of superior colliculus visuomotor receptive fields during head-unrestrained gaze shifts

Affiliations

Intrinsic reference frames of superior colliculus visuomotor receptive fields during head-unrestrained gaze shifts

Joseph F X DeSouza et al. J Neurosci. .

Abstract

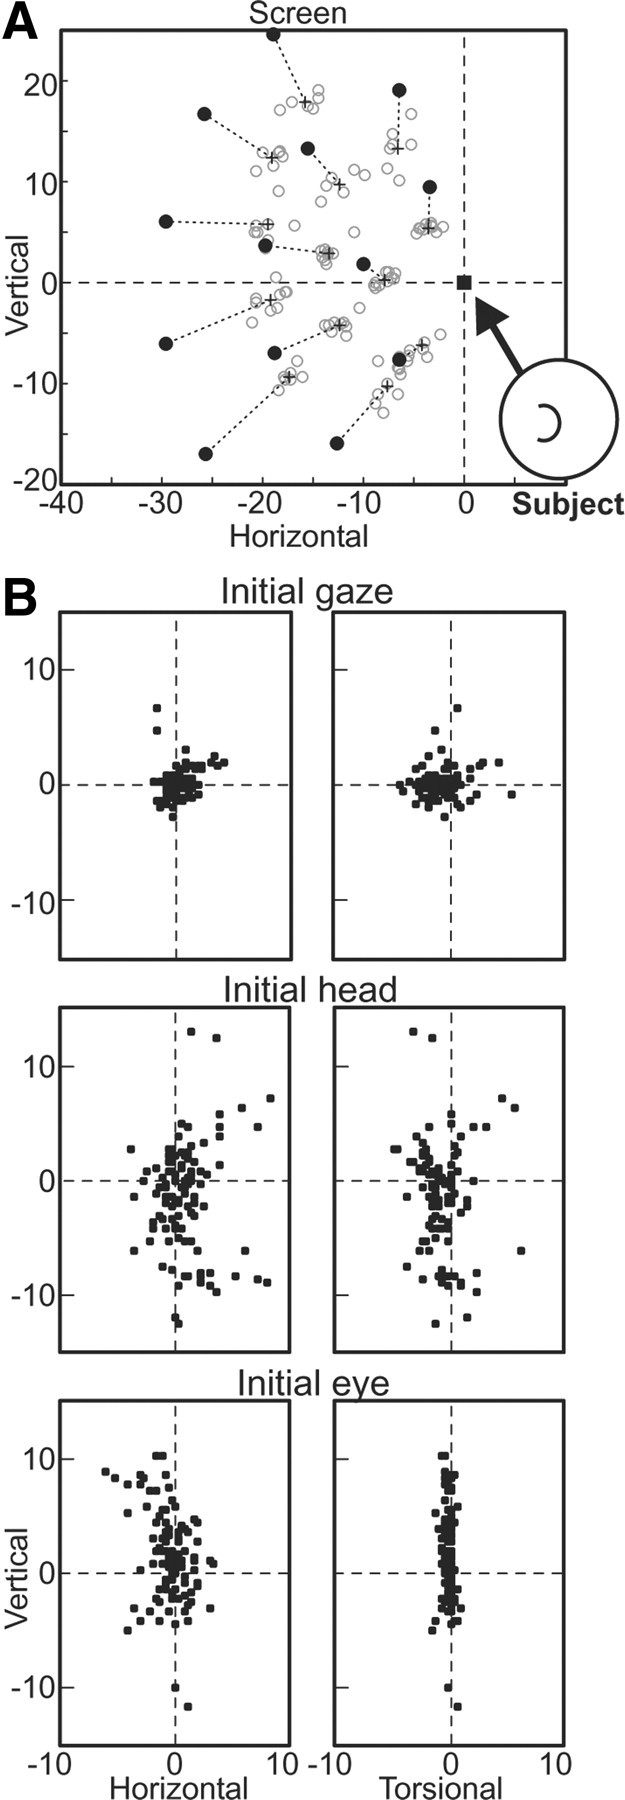
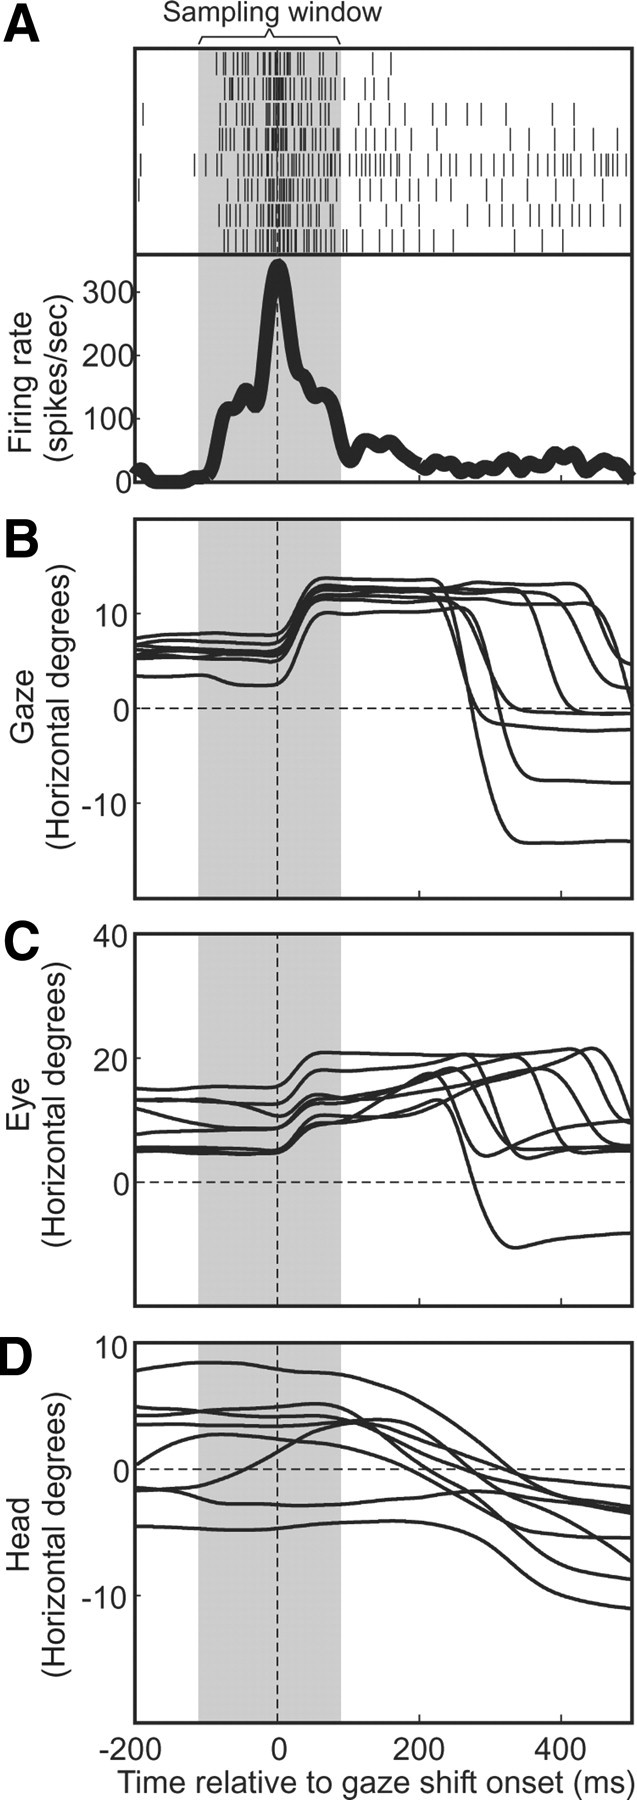
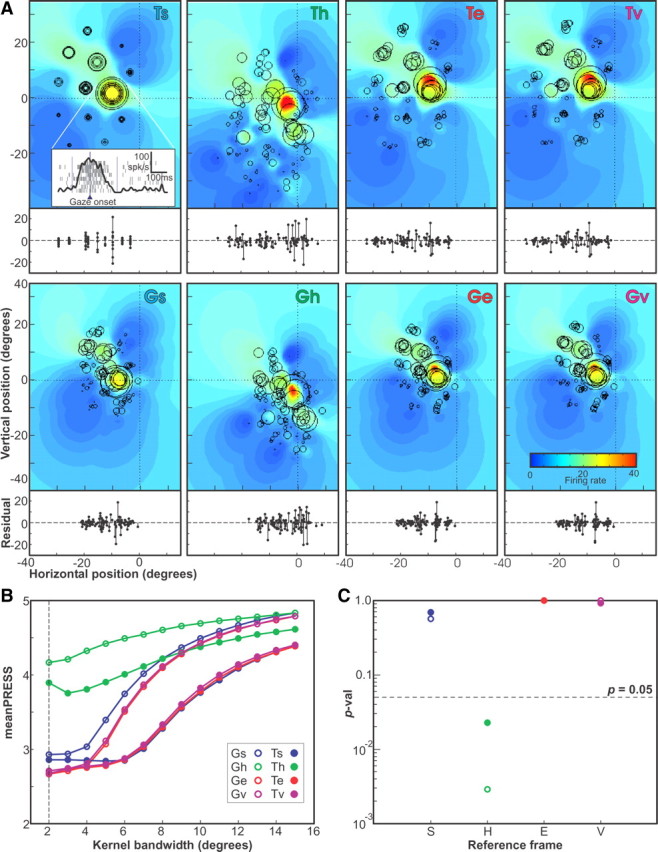
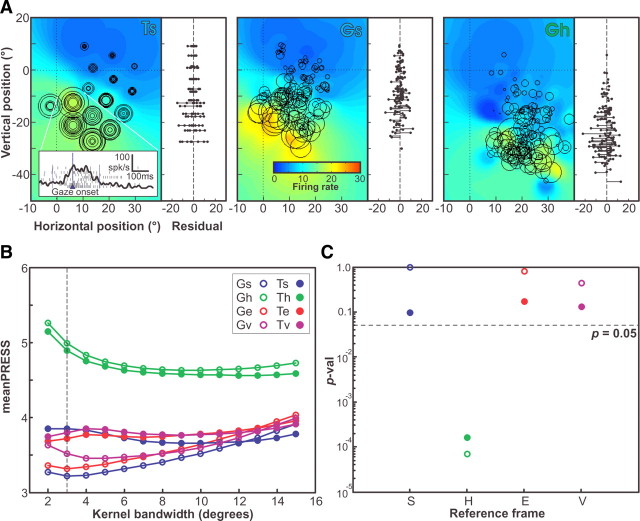
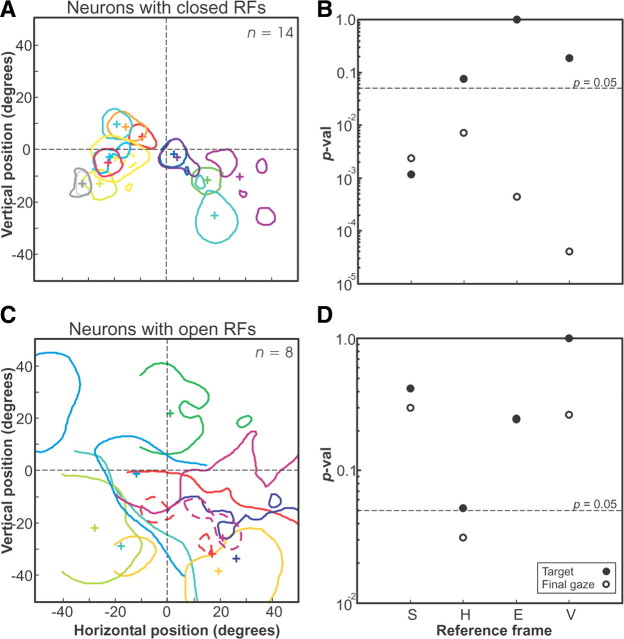
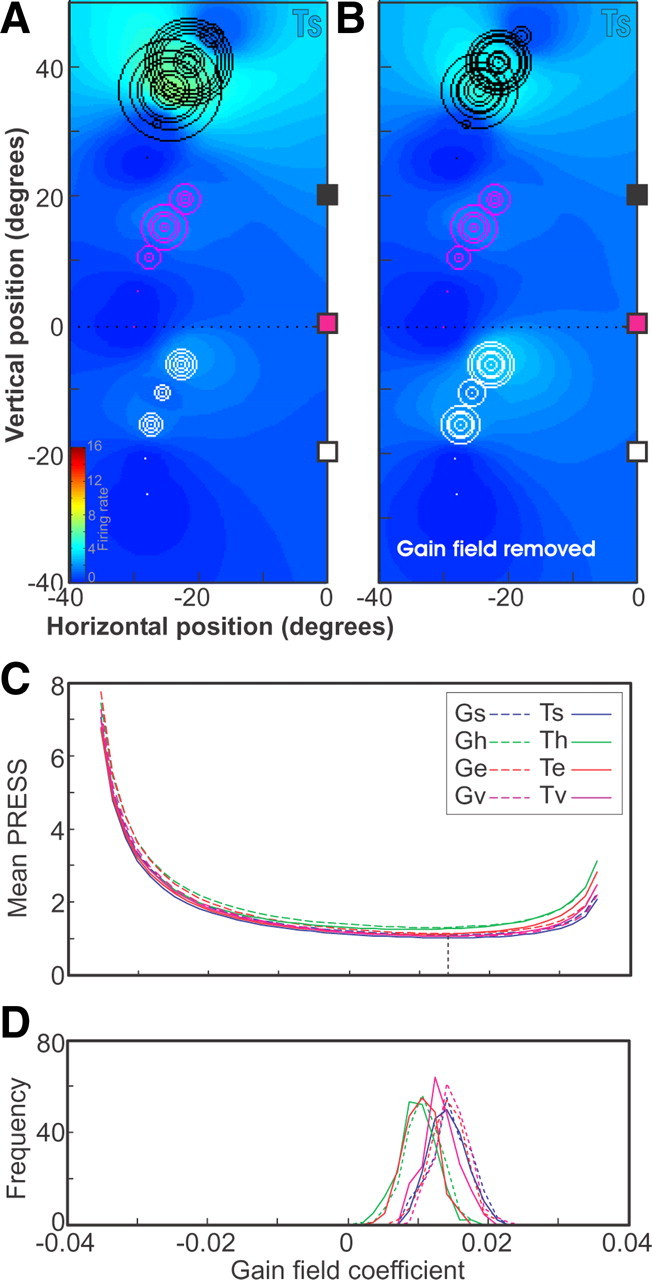
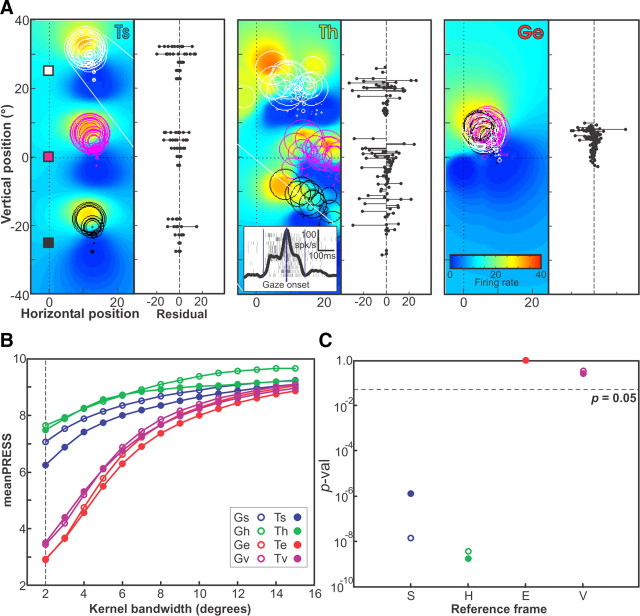
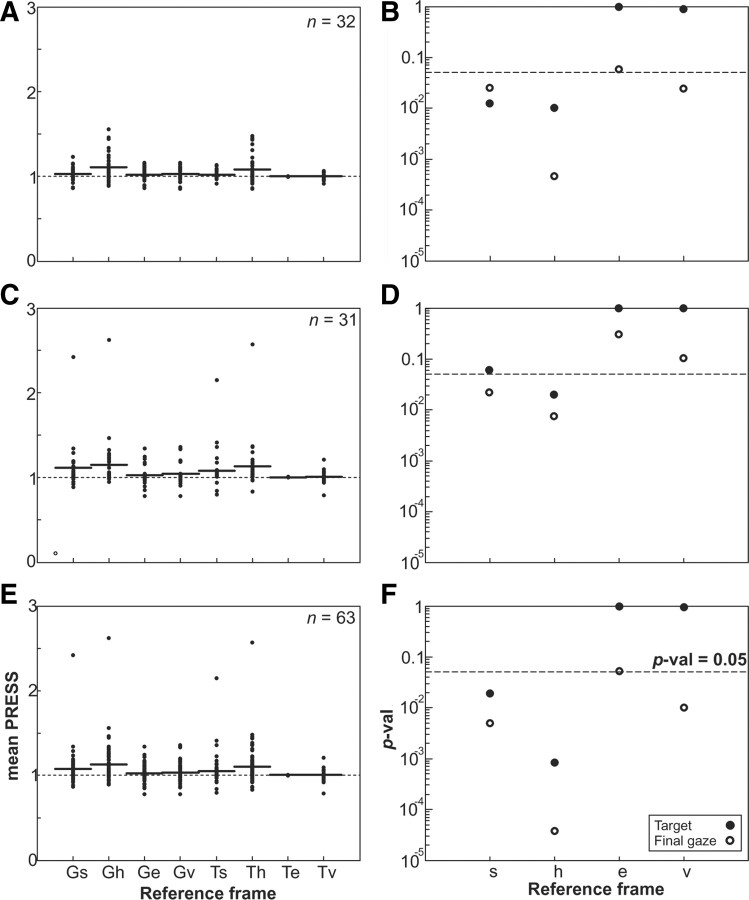
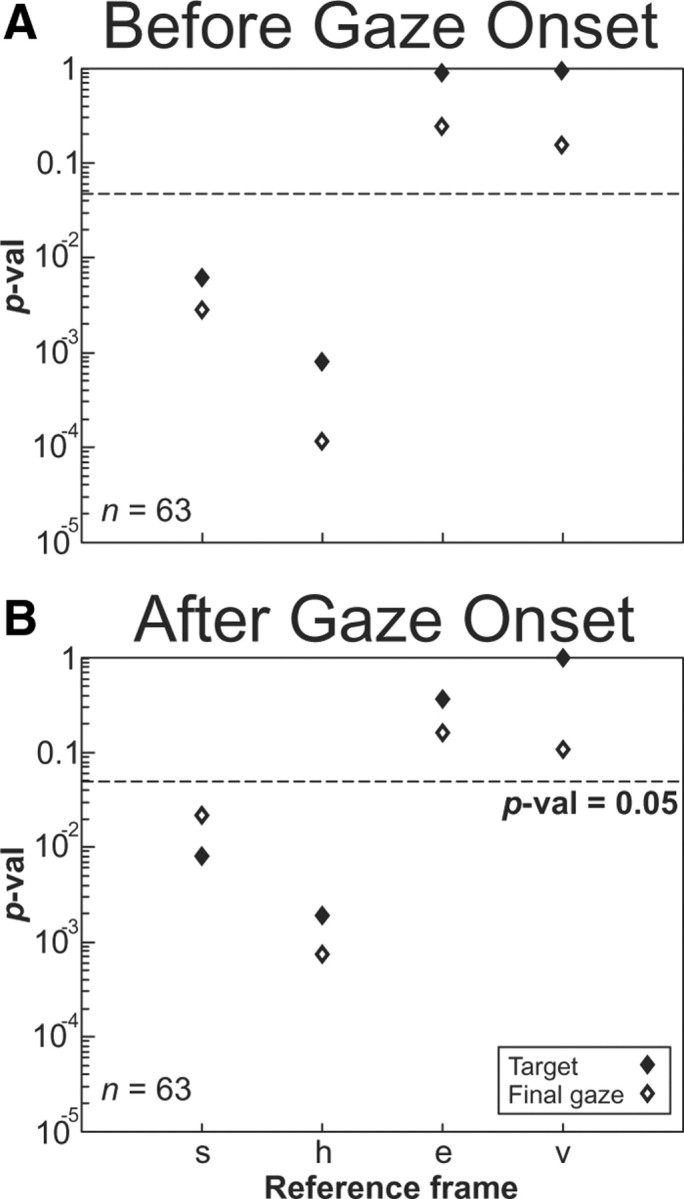
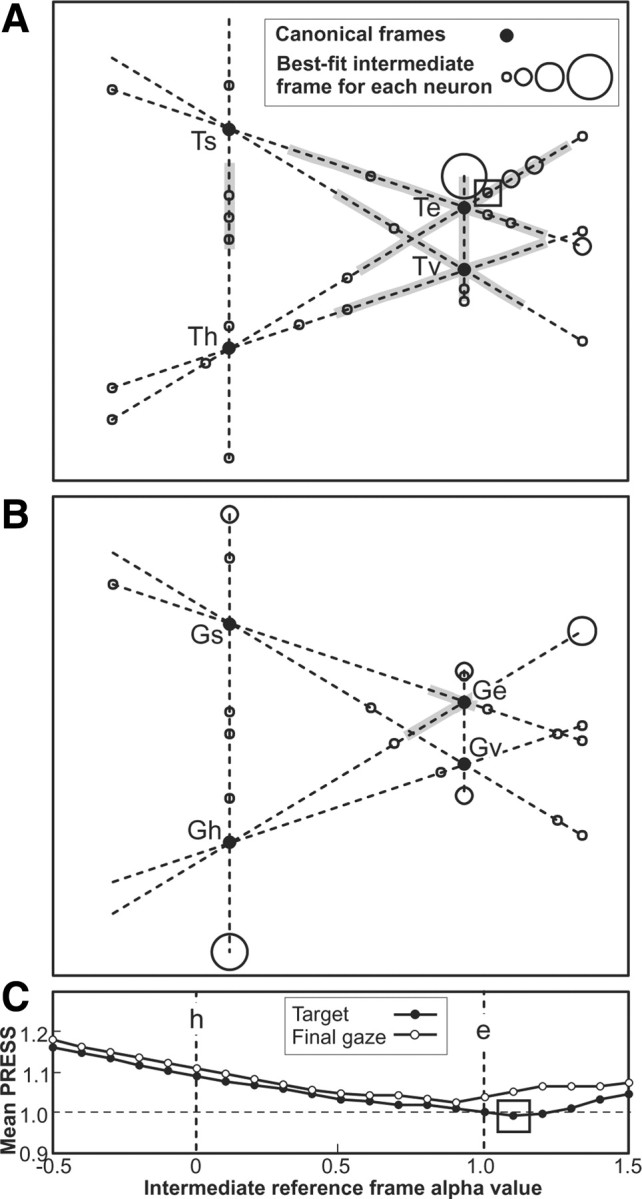
A sensorimotor neuron's receptive field and its frame of reference are easily conflated within the natural variability of spatial behavior. Here, we capitalized on such natural variations in 3-D eye and head positions during head-unrestrained gaze shifts to visual targets in two monkeys: to determine whether intermediate/deep layer superior colliculus (SC) receptive fields code visual targets or gaze kinematics, within four different frames of reference. Visuomotor receptive fields were either characterized during gaze shifts to visual targets from a central fixation position (32 U) or were partially characterized from each of three initial fixation points (31 U). Natural variations of initial 3-D gaze and head orientation (including torsion) provided spatial separation between four different coordinate frame models (space, head, eye, fixed-vector relative to fixation), whereas natural saccade errors provided spatial separation between target and gaze positions. Using a new statistical method based on predictive sum-of-squares, we found that in our population of 63 neurons (1) receptive field fits to target positions were significantly better than fits to actual gaze shift locations and (2) eye-centered models gave significantly better fits than the head or space frame. An intermediate frames analysis confirmed that individual neuron fits were distributed target-in-eye coordinates. Gaze position "gain" effects with the spatial tuning required for a 3-D reference frame transformation were significant in 23% (7/31) of neurons tested. We conclude that the SC primarily represents gaze targets relative to the eye but also carries early signatures of the 3-D sensorimotor transformation.


Figures

Figure 1.
Figure 1.
Experimental set-up and initial and final 3-D orientations for visual saccades made in head-unrestrained conditions. A, While the subject fixates the initial (home) target position (filled square), a saccade target appears at one of a set of positions (filled circles). The subject makes a saccade toward the saccade target and maintains fixation for at least 105 ms. Final gaze directions for all trials are indicated by open gray circles. The center-of-mass of the final gaze directions for all trials made to each saccade-target position are indicated by the cross, connected to the corresponding saccade-target position by a dashed line. B, The 3-D initial gaze (eye-in-space), head, and eye (eye-in-head) orientations are plotted for the same trials as in A.
Figure 2.
Figure 2.
Typical “gaze saccade burst” and associated horizontal gaze, eye, and head positions, plotted as a function of time. Data from all eight trials to the neuron's optimal hot spot are aligned with gaze shift onset. A, The perisaccadic neural activity is plotted for all correct (rewarded) trials made to a single secondary-target position, the rasters (black vertical bars) for each trial plotted on each line, the average firing rate across these trials plotted below as a thick black curve. The sampling window (duration in which spikes were included in firing rate for each of these trials) is indicated by the vertical gray band. B–D, Horizontal gaze (eye-in-space) evolutions across the perisaccadic interval are plotted for each trial (B), as are eye (eye-in-head) position (C) and head position (D). Times in these panels are aligned by gaze shift onset (vertical dashed line).
Figure 3.
Figure 3.
Receptive field analysis—example neuron 1 (104 trials). A, The activity of all trials for the example neuron are plotted using G or T positions in s, h, e, and v reference frames. Also shown are the receptive field fits obtained using the best-fit kernel bandwidth, as indicated by the colored field. Below each receptive field is a plot of the residual firing rates of the trails plotted as a function of horizontal position in each representation (final gaze or target position × reference frame). B, The mean PRESS values for the fits in the eight representations (two position values × four reference frames) for kernel bandwidths from 2° to 15° in 1° steps. The bandwidth that produced the overall best fit (smallest mean PRESS) is indicated by the vertical dashed line. C, The p values of the two-tailed Brown–Forsythe tests comparing the representation of best fit (target in eye) PRESS values obtained using the best-fit kernel bandwidth (2°) with the values in each of the eight representations in turn.
Figure 4.
Figure 4.
Receptive field analysis—example neuron 2 (136 trials). A, The trial activities, represented as described in Figure 3, plotted in terms of target in space (laboratory) frame and in terms of Te, the representation of best fit. For each is shown the fitted receptive field obtained with the kernel bandwidth of best fit (2°), also as in Figure 3. Inset shows the rasters of all trials made to one saccade-target position, along with an integrated firing rate. Beside each receptive field is plotted the residual firing rates for all trials plotted as a function of vertical position in each representation. B, The mean PRESS values for fits obtained at kernel bandwidths of 2–15° in all eight representations (two positions × four reference frames), as in Figure 3. C, The p values of the Brown–Forsythe tests comparing the PRESS values of the representation of best fit with all eight representations.
Figure 5.
Figure 5.
Hot spots of neurons with closed and open receptive fields. A, Closed receptive-field neuron hot spots for fits of target position in eye frame, along with the center of mass of each hot spot (+). Here, hot spots were defined as regions of >50% of maximum fit firing rate. Only those neurons having a hot spot are plotted (22 of 32 neurons). B, p values comparing the best-fit frame (Te) with each other frame for the population of neurons from A. C, Open receptive-field neuron hot spots (“holes” in these hot spots are indicated by dashed lines). D, The p values comparing the best-fit frame (Tv) for the population of neurons from C.
Figure 6.
Figure 6.
Gain-field statistics and removal. A, Mean PRESS values for the fits of G and T positions in s, h, e, and v frames for a range of linear gain-field coefficient values. The best-fit value, corresponding to the smallest mean PRESS, is indicated by the vertical dashed line. B, Histograms of best-fit linear gain-field coefficients for each position and reference frame for 200 random 80% subsets of trials. C, Fits of data plotted in terms of saccade-target position in Ts, where each trial is represented by a circle whose diameter is proportional to the number of spikes in the sampling window for the trial. Trials associated with the three different home-target positions (colored □) are plotted in different colors. D, Fits of the data for target in space frame where the gain-field factors have been divided out from the activity of each trial.
Figure 7.
Figure 7.
Determination of intrinsic reference frame for example neuron with three widely spaced home-target positions (164 trials). A, Trial activity plotted in terms of saccade-target position in Ts, Th, and Ge, using the same conventions as in Figure 2. Fits of these data representations (colored fields) were made using the kernel bandwidth of best fit (2°). Shown in the inset are the rasters for all trials made to one saccade-target position, along with the integrated firing rate. Shown to the right of each receptive field are the residual PRESS values obtained for all eight representations (two positions × four reference frames) for each representation. B, The mean PRESS values obtained for all eight representations (two positions × four reference frames) for kernel bandwidths from 2° to 15°. C, The p values of the two-tailed Brown–Forsythe test comparing the PRESS residuals of the representation of best fit (Te) with each of the eight representations in turn, using the best-fit kernel bandwidth. Note that the best fit was obtained in Ge despite the fact that the trials were more closely packed in this representation than in either Ts or Th.
Figure 8.
Figure 8.
Neuron population RMS PRESS and p values for neuron populations in different representations. A, C, E, RMS PRESS values are shown for all 8 representations (G and T × s, h, e, and v frames), normalized relative to target-in-eye representation values for 32 neurons whose receptive fields were mapped (A), 31 neurons with three widely spaced home-target positions (C), and the combined population of 63 neurons (E). For the neurons with three widely spaced home-target positions, the replacement PRESS values were used for space and head frames, described in the Materials and Methods and Appendix (supplemental material). B, D, F, The p values of a two-tailed t test comparing the PRESS residuals in each frame relative to the best-fit frame, which was target in eye frame are plotted for the receptive field-mapped neurons (B), the three home-target position neurons (D), and the combined population neurons (F).
Figure 9.
Figure 9.
A, B, Analysis of full population of neurons showing two time windows of before gaze onset (A) and after gaze onset (B) with p values in each reference frame representations. The p values of a two-tailed t test comparing the PRESS residuals in each frame relative to the best-fit frame for the entire population of neurons before gaze onset (A) and after gaze onset (B). All conventions are the same as in Figure 8 except that the diamond symbols illustrate that the data were separated aligned either before or after gaze onset for target (closed symbols) and final gaze position (open symbols).
Figure 10.
Figure 10.
Best-fit intermediate reference frames for 63 neurons. A, The population mean PRESS values of best fits for all 63 neurons combined, for target and final gaze positions plotted in the intermediate reference frames at α intervals of 0.1 on the continuum between head and eye frames. The overall best-fit intermediate frame across all continua is indicated (□). B, C, For individual neurons, the best-fit intermediate reference frames are plotted in B if the best fit occurs for target-position intermediate frame, and in C if it occurs for final-gaze intermediate frame, from across all continuums between the four canonical reference frames: s, h, e, and v. Each neuron's best-fit intermediate frame is indicated by ○, a larger diameter circle indicating more than one neuron at the same frame. Overall best-fit for neuron population, as in A, is indicated (□). Confidence intervals along the continua correspond to intermediate frames that could not be excluded as the best fit (did not have a significantly greater PRESS than the best-fit frame at the p = 0.05 level), and are indicated by the gray zones.

Similar articles

Cited by

References

    1. Andersen RA, Mountcastle VB. The influence of the angle of gaze upon the excitability of the light-sensitive neurons of the posterior parietal cortex. J Neurosci. 1983;3:532–548. - PMC - PubMed
    1. Andersen RA, Essick GK, Siegel RM. Encoding of spatial location by posterior parietal neurons. Science. 1985;230:456–458. - PubMed
    1. Andersen RA, Bracewell RM, Barash S, Gnadt JW, Fogassi L. Eye position effects on visual, memory, and saccade-related activity in areas LIP and 7a of macaque. J Neurosci. 1990;10:1176–1196. - PMC - PubMed
    1. Avillac M, Denève S, Olivier E, Pouget A, Duhamel JR. Reference frames for representing visual and tactile locations in parietal cortex. Nat Neurosci. 2005;8:941–949. - PubMed
    1. Basso MA, Wurtz RH. Modulation of neuronal activity in superior colliculus by changes in target probability. J Neurosci. 1998;18:7519–7534. - PMC - PubMed

Publication types

LinkOut - more resources