. 2011 Dec 14;31(50):18338-52.
doi: 10.1523/JNEUROSCI.1249-11.2011.

Role of the glyoxalase system in astrocyte-mediated neuroprotection

Affiliations

Role of the glyoxalase system in astrocyte-mediated neuroprotection

Mireille Bélanger et al. J Neurosci. .

Abstract

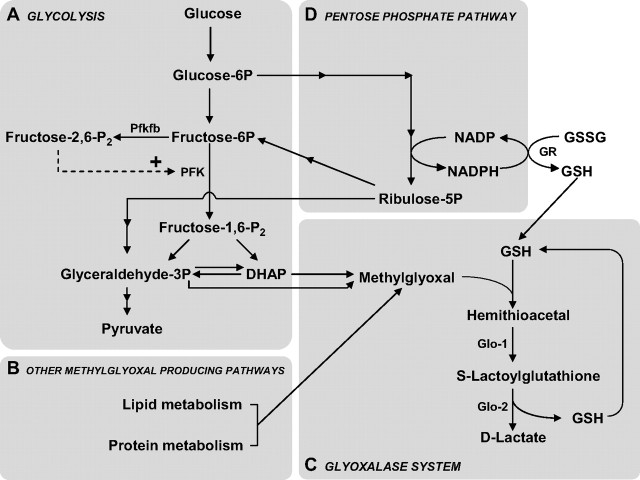
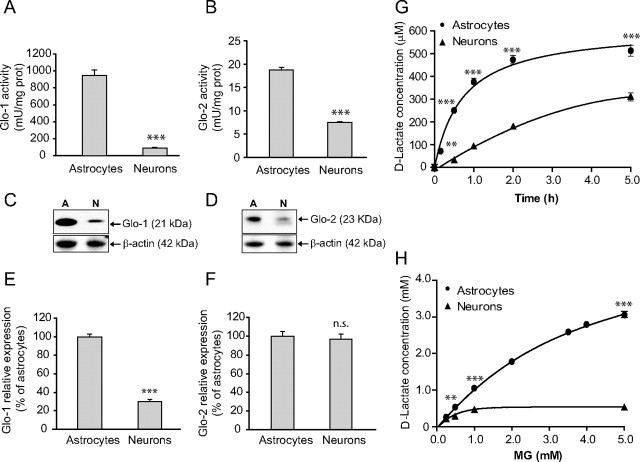
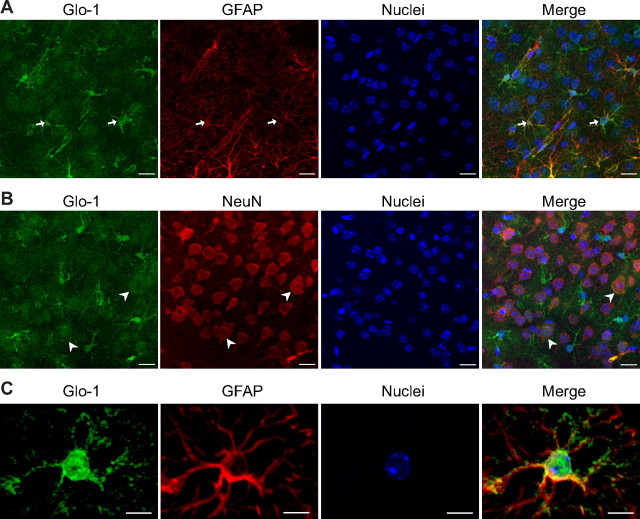
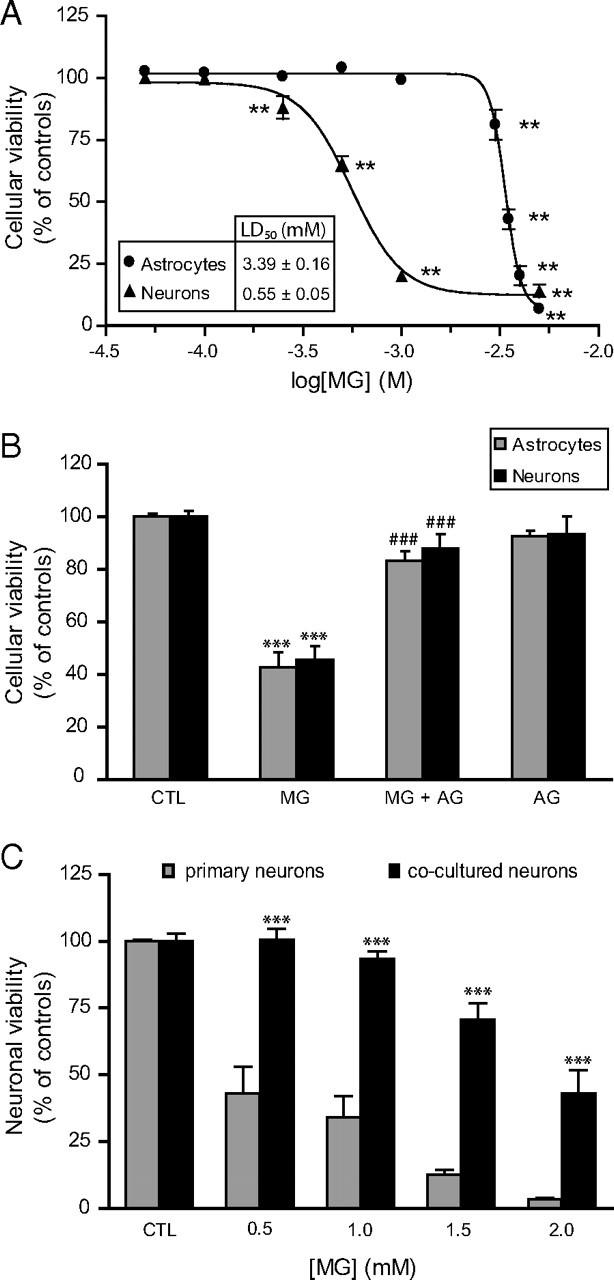
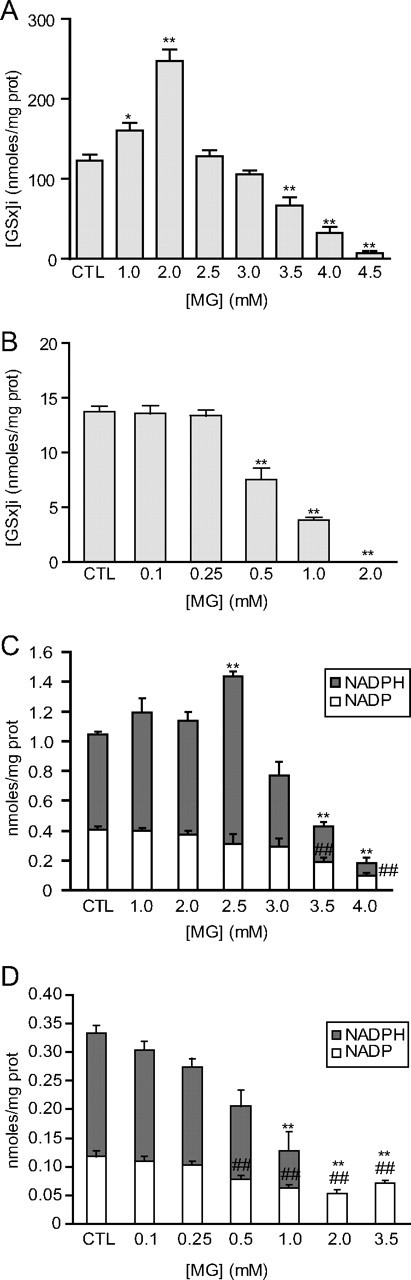
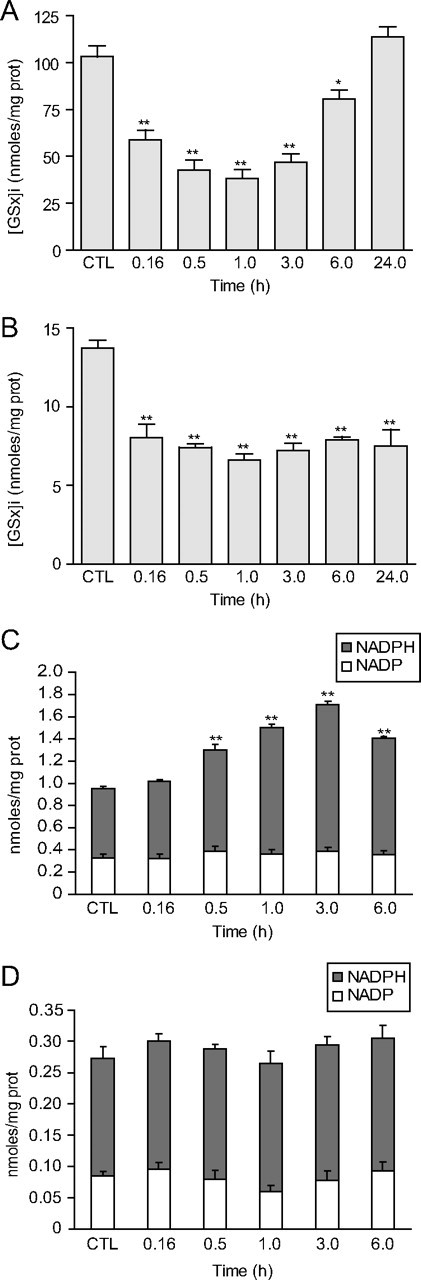
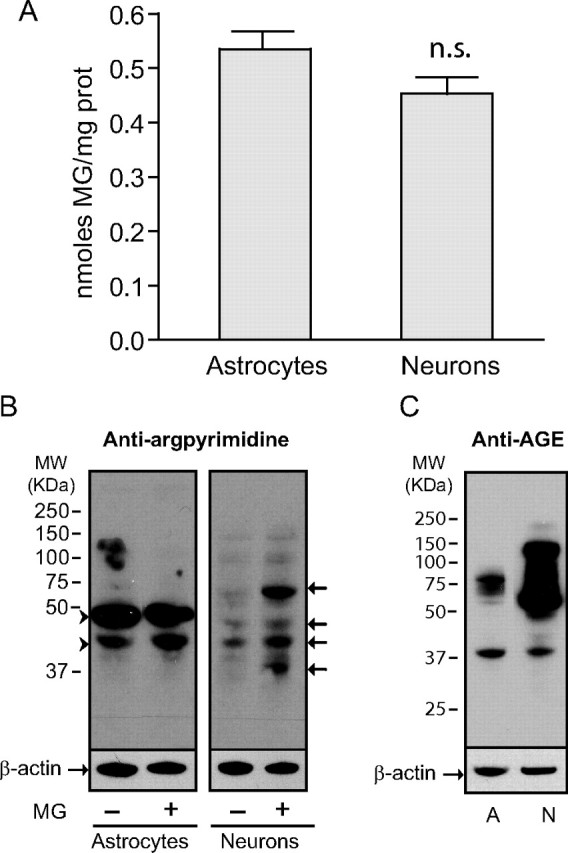
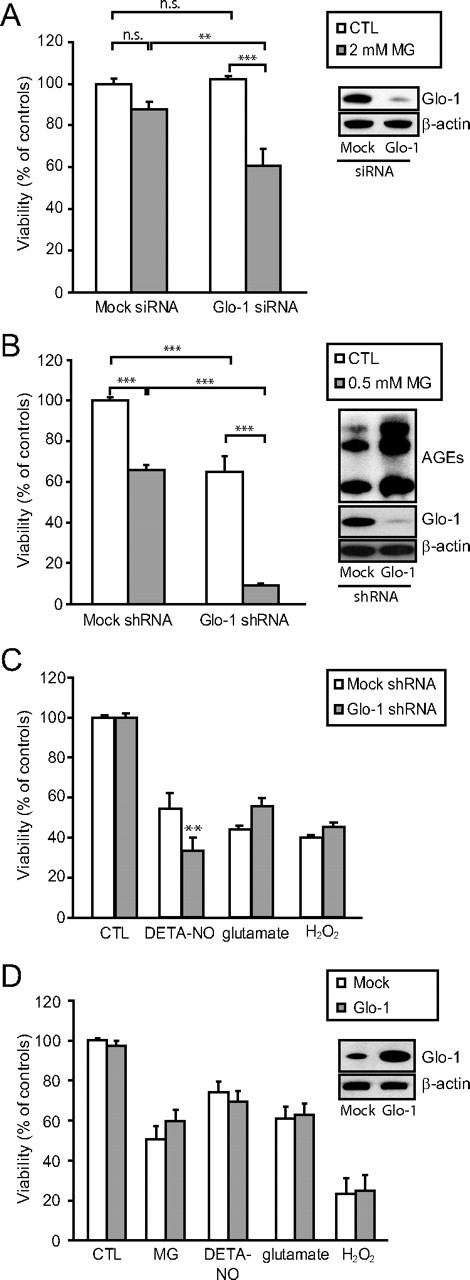
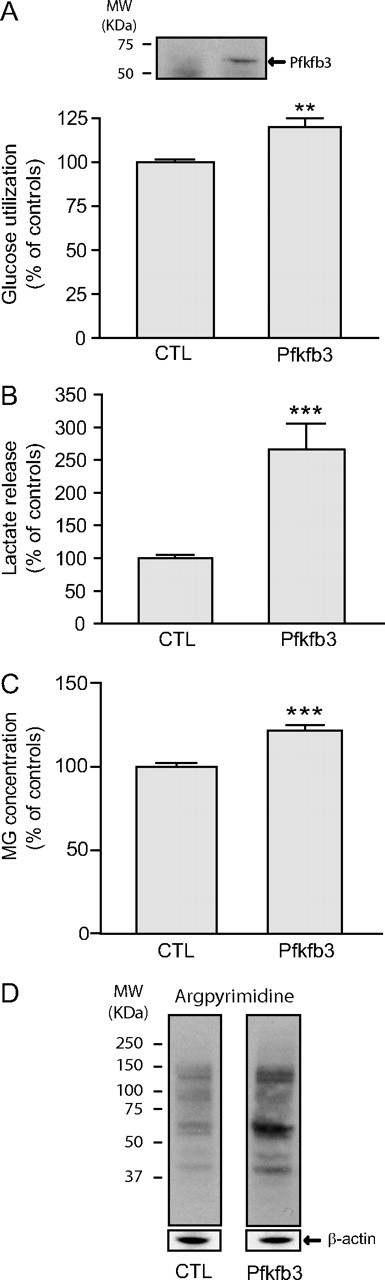
The glyoxalase system is the most important pathway for the detoxification of methylglyoxal (MG), a highly reactive dicarbonyl compound mainly formed as a by-product of glycolysis. MG is a major precursor of advanced glycation end products (AGEs), which are associated with several neurodegenerative disorders. Although the neurotoxic effects of MG and AGEs are well characterized, little is known about the glyoxalase system in the brain, in particular with regards to its activity in different neural cell types. Results of the present study reveal that both enzymes composing the glyoxalase system [glyoxalase-1 (Glo-1) and Glo-2] were highly expressed in primary mouse astrocytes compared with neurons, which translated into higher enzymatic activity rates in astrocytes (9.9- and 2.5-fold, respectively). The presence of a highly efficient glyoxalase system in astrocytes was associated with lower accumulation of AGEs compared with neurons (as assessed by Western blotting), a sixfold greater resistance to MG toxicity, and the capacity to protect neurons against MG in a coculture system. In addition, Glo-1 downregulation using RNA interference strategies resulted in a loss of viability in neurons, but not in astrocytes. Finally, stimulation of neuronal glycolysis via lentiviral-mediated overexpression of 6-phosphofructose-2-kinase/fructose-2,6-bisphosphatase-3 resulted in increased MG levels and MG-modified proteins. Since MG is largely produced through glycolysis, this suggests that the poor capacity of neurons to upregulate their glycolytic flux as compared with astrocytes may be related to weaker defense mechanisms against MG toxicity. Accordingly, the neuroenergetic specialization taking place between these two cell types may serve as a protective mechanism against MG-induced neurotoxicity.


Figures

Figure 1.
Figure 1.
Schematic representation of the main metabolic pathways involved in MG production and elimination. A, B, MG is formed mainly by the fragmentation of the glycolytic intermediates glyceraldehyde-3P and DHAP (A), but also from the metabolism of lipids and proteins (B). PFK is the rate-limiting step of glycolysis and thus constitutes an important regulatory site, and one of its most potent allosteric activators is fructose-2,6-P2. Fructose-2,6-P2 levels are controlled by the Pfkfb, which is most abundantly expressed in astrocytes compared with neurons (Herrero-Mendez et al., 2009). C, MG is detoxified principally via the glyoxalase system, which consists of the enzymes Glo-1 and Glo-2. The first step of MG detoxification requires its spontaneous reaction with GSH to form a hemithioacetal, which is used as a substrate by Glo-1 to form S-lactoylglutathione. Glo-2 then catalyzes the transformation of S-lactoylglutathione into d-lactate, recycling GSH in the process. D, The pentose phosphate pathway is linked to MG detoxification via the formation of NADPH, which is required for the recycling of GSH from its oxidized form (GSSG) via the action of glutathione reductase (GR).
Figure 2.
Figure 2.
Characterization of the glyoxalase system in astrocytes and neurons. A, B, Glo-1 (A) and Glo-2 (B) activity in primary cultured astrocytes and neurons prepared from mouse cortex. Results are means ± SEM of at least 12 determinations from three independent experiments. Data were statistically analyzed using a Student's t test (***p ≤ 0.001 vs astrocytes). C, D, Glo-1 (C) and Glo-2 (D) protein expression in cultured astrocytes and neurons (designated by A and N, respectively) was assessed by Western blotting. Representative bands are shown. Similar results were obtained in three independent experiments (n = 6). E, F, Glo-1 (E) and Glo-2 (F) mRNA expression was assessed in cultured astrocytes and neurons by qPCR. Results are expressed as a percentage of astrocytic expression and are means ± SEM of six determinations from two independent experiments. Data were statistically analyzed using a Student's t test (***p ≤ 0.001 vs astrocytes; n.s., not significantly different). G, Time course analysis of d-lactate release into the extracellular space following exposure of astrocytes and neurons to MG (500 μm). Results are means ± SEM of at least nine determinations from at least three independent experiments. Data were statistically analyzed with two-way ANOVA followed by Bonferroni's post hoc test (**p ≤ 0.01 and ***p ≤ 0.001 vs neurons). H, Dose–response analysis of d-lactate release into the extracellular space 24 h following exposure to MG in astrocytes and neurons. Results are means ± SEM of at least nine determinations from at least three independent experiments. Data were statistically analyzed with two-way ANOVA followed by Bonferroni's post hoc test (**p ≤ 0.01 and ***p ≤ 0.001 vs neurons).
Figure 3.
Figure 3.
High expression of Glo-1 in astrocytes of the mouse cerebral cortex. Coronal sections of mouse brain were immunostained with Glo-1 and with the astrocytic marker GFAP (A, C) or the neuronal marker NeuN (B). Glo-1 immunostaining was strongest in astrocytes (A, arrows), but was also present in neurons at lower levels (B, arrowheads). C, Scaled-up image of a single astrocyte in the mouse cerebral cortex shows that Glo-1 immunoreactivity is located in the cell body and processes along the GFAP+ filaments. Representative images from one of three animals are shown. Nuclei are stained using Hoechst. Scale bars: 15 μm (A, B) and 7 μm (C).
Figure 4.
Figure 4.
MG toxicity in astrocytes and neurons. A, Dose-dependent decrease in astrocytic and neuronal viability following exposure to MG. Cells were treated with MG and cellular viability was assessed 24 h later using the MTT assay. Results are expressed as a percentage of control values and are means ± SEM of at least nine determinations from at least three independent experiments. Data were statistically analyzed with one-way ANOVA followed by Dunnett's test (**p ≤ 0.01 vs controls). B, Pretreatment with the carbonyl scavenger AG protects astrocytes and neurons against MG-induced toxicity as assessed using the MTT assay. Different concentrations of MG were chosen to produce robust toxicity in both cell types (3.5 and 1 mm MG for astrocytes and neurons, respectively). Where indicated, an equimolar amount of AG (3.5 and 1 mm for astrocytes and neurons, respectively) was added 30 min before the addition of MG and maintained throughout the incubation period (24 h). Results are expressed as a percentage of control (CTL) values and are means ± SEM of at least nine determinations from at least three independent experiments. Data were statistically analyzed with ANOVA followed by Bonferroni's test (***p ≤ 0.001 vs controls; ###p ≤ 0.001 vs MG). C, Astrocytes protect neurons against MG toxicity in astrocyte–neuron cocultures. Primary neurons and cocultures were exposed to the indicated doses of MG, and cellular viability was assessed in the neuronal compartment using the MTT assay. Results are expressed as a percentage of control values and are means ± SEM of at least eight determinations from at least three independent experiments. Data were statistically analyzed with two-way ANOVA followed by Bonferroni's test (***p ≤ 0.001 vs primary neurons).
Figure 5.
Figure 5.
Dose–response effect of MG on the redox state of astrocytes and neurons. A, B, Astrocytes (A) and neurons (B) were exposed to the indicated concentrations of MG, and total intracellular GSH ([GSx]i) was measured 24 h later. Results are expressed as a percentage of control (CTL) values and are means ± SEM of at least eight determinations from at least three independent experiments. Data were statistically analyzed with ANOVA followed by Dunnett's test (*p ≤ 0.05; **p ≤ 0.01). C, D, Dose–response analysis of NADP and NADPH levels in astrocytes (C) and neurons (D) following exposure to the indicated concentrations of MG for 24 h. Results are means ± SEM of at least nine determinations from at least three independent experiments. Data were statistically analyzed with ANOVA followed by Dunnett's test (**p ≤ 0.01 vs CTL NADPH levels; ##p ≤ 0.01 vs CTL NADP levels).
Figure 6.
Figure 6.
Time course analysis of the effects of MG on the redox state of astrocytes and neurons. Astrocytes and neurons were, respectively, exposed to 2.5 and 0.5 mm MG. A, B, Time course analysis of total intracellular GSH ([GSx]i) in astrocytes (A) and neurons (B) following exposure to MG. Results are expressed as percentage of control (CTL) values and are means ± SEM of at least eight determinations from at least three independent experiments. Data were statistically analyzed with ANOVA followed by Dunnett's test (*p ≤ 0.05; **p ≤ 0.01). C, D, Time course analysis of NADP and NADPH levels in astrocytes (C) and neurons (D) following exposure to MG. Results are means ± SEM of at least nine determinations from at least nine independent experiments. Data were statistically analyzed with ANOVA followed by Dunnett's test (**p ≤ 0.01 vs CTL NADPH levels).
Figure 7.
Figure 7.
Neurons are more susceptible to MG-induced protein modifications. A, Similar levels of MG were measured in astrocytes and neurons by HPLC. Results are means ± SEM of at least 13 determinations from at least four independent experiments. Data were statistically analyzed using a Student's t test (n.s., not significantly different). B, Argpyrimidine levels were assessed by Western blotting in astrocytes and neurons. Some cultures were exposed to 0.5 mm MG for 24 h before protein extraction. Arrowheads mark proteins highly modified by argpyrimidine in astrocytes. Arrows mark neuronal proteins showing increased argpyrimidine immunoreactivity following exposure to MG. C, AGE levels were assessed by Western blotting in control cultures of astrocytes (A) and neurons (N). B, C, Representative bands are shown. Similar results were obtained in three independent experiments (n = 6).
Figure 8.
Figure 8.
Effects of RNA interference against Glo-1 in astrocytes and neurons. A, Astrocytes were transfected with siRNA against Glo-1 or negative control siRNA (mock siRNA). Representative Western blot bands demonstrating the resulting decrease in Glo-1 expression are shown. Cells were subsequently exposed to vehicle (white bars) or 2 mm MG (gray bars), and cellular viability was assessed 24 h later using the MTT viability assay. Results are expressed as a percentage of controls (CTL) and are means ± SEM of at least six determinations from at least two independent experiments. Data were statistically analyzed with two-way ANOVA followed by Tukey's multiple-comparisons test (n.s., not significantly different; **p ≤ 0.01; ***p ≤ 0.001). B, Glo-1-targeted shRNAs (or mock shRNAs) were delivered in neurons using lentiviral vectors. Representative Western blot bands demonstrating the resulting decrease in Glo-1 expression and increase in AGE levels are shown. Cells were subsequently exposed to vehicle (white bars) or 0.5 mm MG (gray bars) and cellular viability was assessed 24 h later. Results are expressed as a percentage of controls and are means ± SEM of six determinations from two independent experiments. Data were statistically analyzed with two-way ANOVA followed by Tukey's multiple-comparison test (***p ≤ 0.001). C, Glo-1-targeted shRNAs (gray bars) or mock shRNAs (white bars) were delivered in neurons using lentiviral vectors. Neurons were subsequently exposed to various cellular stresses (DETA-NO, 100 μm for 24 h; glutamate, 10 μm for 4 h; and H2O2, 25 μm for 4 h) before assessing cellular viability using the MTT assay. Results are expressed as a percentage of controls and are means ± SEM of at least six determinations from at least two independent experiments. Data were statistically analyzed with two-way ANOVA followed by Bonferroni's test (**p ≤ 0.01). D, Glo-1 (gray bars) or a mock construction (white bars) were delivered in neurons using lentiviral vectors. Neurons were subsequently exposed to various cellular stresses (MG, 500 μm for 24 h; DETA-NO, 100 μm for 24 h; glutamate, 10 μm for 4 h; and H2O2, 25 μm for 4 h) before assessing cellular viability using the MTT assay. Results are expressed as percentage of controls and are means ± SEM of at least nine determinations from at least three independent experiments. Data were statistically analyzed with two-way ANOVA followed by Bonferroni's test and no statistical differences could be found between mock and Glo-1 groups in any of the conditions.
Figure 9.
Figure 9.
Enhanced neuronal glycolysis via Pfkfb3 overexpression results in elevated MG levels. Pfkfb3 was overexpressed in neurons using lentiviral vectors and the following measurements were made 1 week later. A, Top panel, Pfkfb3 overexpression was confirmed by Western blotting; bottom panel, glucose utilization as measured by [3H]-2-DG uptake (data are expressed as a percentage of control values and are means ± SEM of at least 9 determinations from at least 3 independent experiments; control values were 211.8 ± 29.5 fmol/mg protein/20 min). B, Lactate release into the extracellular medium (data are expressed as percentage of control values and are means ± SEM of at least 9 determinations from at least 3 independent experiments; control values were 282.9 ± 50.1 nmol/mg protein/20 min). C, MG levels by HPLC (values are means ± SEM of at least 10 determinations from at least 4 independent experiments). A–C, Data were statistically analyzed using a Student's t test (**p ≤ 0.01; ***p ≤ 0.001). D, Western blot analysis shows increased neuronal argpyrimidine levels following Pfkfb3 overexpression. Representative bands are shown. Similar results were obtained in three independent experiments (n ≥ 8).

Similar articles

Cited by

References

    1. Ahmed N, Battah S, Karachalias N, Babaei-Jadidi R, Horányi M, Baróti K, Hollan S, Thornalley PJ. Increased formation of methylglyoxal and protein glycation, oxidation and nitrosation in triosephosphate isomerase deficiency. Biochim Biophys Acta. 2003;1639:121–132. - PubMed
    1. Allaman I, Pellerin L, Magistretti PJ. Glucocorticoids modulate neurotransmitter-induced glycogen metabolism in cultured cortical astrocytes. J Neurochem. 2004;88:900–908. - PubMed
    1. Allaman I, Gavillet M, Bélanger M, Laroche T, Viertl D, Lashuel HA, Magistretti PJ. Amyloid-β aggregates cause alterations of astrocytic metabolic phenotype: impact on neuronal viability. J Neurosci. 2010;30:3326–3338. - PMC - PubMed
    1. Allaman I, Bélanger M, Magistretti PJ. Astrocyte-neuron metabolic relationships: for better and for worse. Trends Neurosci. 2011;34:76–87. - PubMed
    1. Almeida A, Almeida J, Bolaños JP, Moncada S. Different responses of astrocytes and neurons to nitric oxide: the role of glycolytically generated ATP in astrocyte protection. Proc Natl Acad Sci U S A. 2001;98:15294–15299. - PMC - PubMed

Publication types

Substances