. 2011 Dec 14;31(50):18364-80.
doi: 10.1523/JNEUROSCI.4690-11.2011.

Bidirectional ephrinB3/EphA4 signaling mediates the segregation of medial ganglionic eminence- and preoptic area-derived interneurons in the deep and superficial migratory stream

Affiliations

Bidirectional ephrinB3/EphA4 signaling mediates the segregation of medial ganglionic eminence- and preoptic area-derived interneurons in the deep and superficial migratory stream

Geraldine Zimmer et al. J Neurosci. .

Abstract

The integration of interneuron subtypes into specific microcircuits is essential for proper cortical function. Understanding to what extent interneuron diversity is regulated and maintained during development might help to reveal the principles that govern their role as synchronizing elements as well as causes for dysfunction. Particular interneuron subtypes are generated in a temporally regulated manner in the medial ganglionic eminence (MGE), the caudal ganglionic eminence, and the preoptic area (POA) of the basal telencephalon. Long-range tangential migration from their site of origin to cortical targets is orchestrated by a variety of attractive, repulsive, membrane-bound, and secreted signaling molecules, to establish the critical balance of inhibition and excitation. It remains unknown whether interneurons deriving from distinct domains are predetermined to migrate in particular routes and whether this process underlies cell type-specific regulation. We found that POA- and MGE-derived cortical interneurons migrate within spatially segregated corridors. EphrinB3, expressed in POA-derived interneurons traversing the superficial route, acts as a repellent signal for deeply migrating interneurons born in the MGE, which is mediated by EphA4 forward signaling. In contrast, EphA4 induces repulsive ephrinB3 reverse signaling in interneurons generated in the POA, restricting this population to the superficial path. Perturbation of this bidirectional ephrinB3/EphA4 signaling in vitro and in vivo leads to a partial intermingling of cells in these segregated migratory pathways. Thus, we conclude that cell contact-mediated bidirectional ephrinB3/EphA4 signaling mediates the sorting of MGE- and POA-derived interneurons in the deep and superficial migratory stream.


Figures
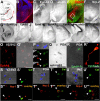
Figure 1.
Figure 1.
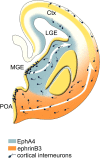
The deep and superficial migratory stream is differentially demarcated by EphA4 and ephrinB3 expression. A, Schematic illustration of the deep and superficial migratory stream and the anatomical regions in a hemisphere of an E14 coronal brain slice presented in B–N. B, Overlay of DAPI and calbindin immunostaining of a coronal hemisphere (E14). C, D, In situ hybridization against EphA4 (C) and ephrinB3 (D) was performed on alternating E14 brain slices. E, Pseudocolor overlay of C and D directly illustrates the complementary expression of EphA4 and ephrinB3. F–N, In situ hybridizations using riboprobes against Nrp-2, EphB1, EphB2, EphB3, EphA3, EphA5, ephrinB1, and ephrinB2. O, EphA4 immunostaining of dissociated cells prepared from the VZ/SVZ of the MGE (E14 plus 1 div). O′, Overlay of the EphA4 immunostaining shown in O with the respective phase-contrast microphotograph. Colabeling of EphA4 and calbindin in cells prepared from the VZ/SVZ (E14 plus 1 div) is shown in P–P‴ (arrowhead). Overlay of a transmitted light microphotograph with DAPI staining (P), calbindin immunostaining (P′), EphA4 immunostaining (P″), and overlay of calbindin (green) and EphA4 (red) (P‴). The arrow points to a double-labeled neuron. Q, In situ hybridization in dissociated neurons prepared from the POA (E14 plus 1 div) using an ephrinB3 riboprobe. R, R′, Calbindin-positive interneurons prepared from the POA exhibit Alexa 488-labeled EphB1-Fc binding sites, which label ephrinB ligands. S–S‴, Double labeling of calbindin and Nrp-1 in cells isolated from the VZ/SVZ of the MGE. S–S‴, Overlay of a transmitted light microphotograph with DAPI staining (S), calbindin immunostaining (S′), Nrp-1 immunostaining (S″), and overlay of calbindin (green) and Nrp-1 (red) (S‴). In T–T‴ and U–U‴, double labeling of calbindin and Nrp-2 in cells isolated from the POA and IMZ, respectively. T, U, Overlay of a transmitted light microphotograph with DAPI staining. T′, U′, Calbindin immunostaining. T″, U″, Nrp-2 immunostaining. T‴, U‴, Overlay of calbindin (green) and Nrp-2 (red). POA, Preoptic area; MGE, medial ganglionic eminence; LGE, lateral ganglionic eminence; Ctx, cortex; DMS, deep migratory stream; SMS, superficial migratory stream. Scale bars: B–N, 200 μm; O, O′, 100 μm; U, 50 μm; P–P‴, R′, S‴–U‴, 10 μm.
Figure 2.
Figure 2.
EphA4 and ephrinB3 are involved in the spatial segregation of deeply and superficially migrating interneurons. A, Schematic illustration of grafting experiments (presented in B, C, and D–G). B, Heterotopic transplantation of an EGFP-expressing VZ/SVZ-derived microexplant to the POA of a wild-type slice. C, Heterotopic transplantation of an EGFP-expressing IMZ-derived microexplant to the POA of a wild-type slice. D, Transmitted light microphotographs of a living organotypic brain slice (E14) 22 h after heterotopic transplantation of an EGFP-VZ/SVZ-derived explant to the POA of the host slice. E–G, Sequences of time-lapse recordings of grafted EGFP-VZ/SVZ cells after 22, 26, and 28 h. H, EGFP-transfected MGE cells 24 h after ex utero electroporation of hemispheres (E14). The site of transfection is indicated by the white arrowhead. J–L, Sequences of time-lapse recordings of ex utero EGFP-transfected MGE cells in organotypic slice cultures after 38, 39, and 42 h in vitro. The white arrowheads in J–L label an MGE-derived cell migrating along the deep route. M, N, Analysis of the distribution (M) and distance (N) of nontransfected and EphA4-siRNA transfected EGFP-expressing VZ/SVZ-derived cells in wild-type slices 48 h after heterotopic transplantation to the POA. O, P, Analysis of the distribution (O) and distance (P) of nontransfected and ephrinB3-siRNA transfected EGFP-expressing IMZ-derived cells in wild-type slices 48 h after heterotopic transplantation to the POA. Error bars indicate SEM. ***p < 0.0001, **p > 0.001, *p < 0.05. Q–U, EphA4 siRNA reduces EphA4 expression in MGE-derived dissociated neurons. Q, Overlay of a transmitted light microphotograph of dissociated MGE cells with DAPI staining. R, EphA4 siRNA was coadministered with Alexa 555-conjugated control siRNA. S, Immunohistochemistry using an antibody directed against EphA4 resulted in reduced EphA4 staining intensity in cells transfected with EphA4 siRNA (overlay in T). U, EphrinB3-expressing NIH 3T3 fibroblasts cotransfected with Alexa 555-conjugated control siRNA and ephrinB3 siRNA. POA, Preoptic area; MGE, medial ganglionic eminence; LGE, lateral ganglionic eminence; Ctx, cortex; DMS, deep migratory stream; SMS, superficial migratory stream; VZ/SVZ, ventricular zone/subventricular zone; IMZ, intermediate zone. Scale bars: B, C, G, H, L, 200 μm; T, 10 μm; U, 50 μm.
Figure 3.
Figure 3.
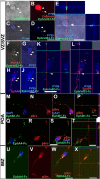
Binding studies revealed ephrinB3-induced phosphorylation of Eph receptors in cells derived from the VZ/SVZ of the MGE (forward signaling) and EphB1/EphA4-induced Src phosphorylation in POA- and IMZ-derived cells (reverse signaling). A–E, Triple immunostaining revealed that ephrinB3-Fc binding sites are colocalized with PY99 signals in calbindin-expressing cells prepared from the VZ/SVZ of the MGE, indicating activated Eph receptors. A, Overlay of the transmitted-light microphotograph with the ephrinB3-Fc binding sites. B, Overlay of the calbindin and PY99 immunostaining with the ephrinB3-Fc binding sites. C, D, Overlay of the transmitted-light microphotograph with the PY99 immunostaining (C) and overlay of the PY99 immunostaining (blue) with the ephrinB3-Fc binding sites (green) (D). E illustrates X and Y line scans through a single optical plane for the colocalization of ephrinB3-Fc Alexa 488 (green) and PY99 (blue) in combination with transmitted light. F–L, EphrinB3-Fc binding (green) in VZ/SVZ cells is colocalized with the PY99 (blue) and EphA4 signal (red) indicating EphA4 receptor activation by ephrinB3. F, Overlay of the transmitted-light microphotograph with the ephrinB3-Fc binding sites (green) and EphA4 immunostaining (red). G, Overlay of the transmitted-light microphotograph with the PY99 immunostaining. H, J, EphA4 immunostaining (H) and overlay of PY99 (blue) immunostaining and ephrinB3-Fc sites (green) (J). K illustrates an X and Y line scan through a single optical plane for the colocalization of ephrinB3-Fc Alexa 488 (green) and PY99 (blue), while L illustrates the colocalization of ephrinB3-Fc Alexa 488 (green), EphA4 (red), and PY99 (blue). M–T, Alexa 488 marked EphB1-Fc (M–P) and EphA4-Fc binding sites (Q–T) are colabeled with phosphorylated Src (pSrc) in POA-derived single cells, suggesting activated ligands and reverse signaling. Overlay of EphB1-Fc and EphA4-Fc with DAPI staining is presented in M and Q. The respective phospho-Src immunostaining is shown in N and R. The overlay of phospho-Src and EphB1-Fc or EphA4-Fc is illustrated in O and S, respectively. U–X, EphA4-Fc also induces Src activation in IMZ-derived cells. Overlay of EphA4-Fc with DAPI staining is presented in U. The respective phospho-Src immunostaining is shown in V. The overlay of phospho-Src (red) and EphA4-Fc binding (green) is illustrated in W. P, T, X, Colocalization of Alexa 488-labeled EphB1-Fc or EphA4-Fc (green) with pSrc (red) is illustrated in X and Y line scans through a single optical plane for POA (P, T) and IMZ cells (X). POA, Preoptic area; VZ/SVZ, ventricular zone/subventricular zone; IMZ, intermediate zone. Scale bars, 10 μm.
Figure 4.
Figure 4.
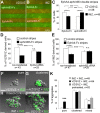
Stripe assays reveal that ephrinB3 triggers a repulsive response in VZ/SVZ cells mediated by the EphA4 receptor, while EphA4 acts as a repellent for cells prepared from the IMZ inducing ephrinB3 reverse signaling. A, Neurons prepared from the VZ/SVZ of the MGE avoid ephrinB3-containing lanes in the stripe assay. B, IMZ-derived neurons avoid EphA4 stripes after 2 d in vitro. C, Quantitative analysis of the distribution of VZ/SVZ- and IMZ-derived cells in alternating stripes of ephrinB3-Fc and EphA4-Fc. D, Quantitative analysis of the distribution of nontransfected and EphA4 siRNA-transfected MGE cells prepared from the VZ/SVZ of the MGE on alternating stripes of ephrinB3-Fc and control lanes after 2 d in vitro. E, Quantitative analysis of the distribution of nontransfected and ephrinB3 siRNA-transfected MGE cells prepared from the IMZ on alternating stripes of EphA4-Fc and control lanes after 2 d in vitro. Selective adhesion of neurons isolated from the two migratory streams was analyzed with the short-term aggregation assay. F–K, The segregation of cells derived from the VZ/SVZ and IMZ in the aggregation assay depends on EphA4-ephrinB3 signaling. F, Pure aggregates containing only wild-type cells of the VZ/SVZ. G, Segregation of EGFP-IMZ and wild-type-VZ/SVZ cells into clusters within one aggregate. H, Mixed aggregate containing EGFP-labeled and wild-type cells of the IMZ (control). J, Mixed aggregate obtained after pretreatment of wild-type VZ/SVZ cells with ephrinA3-Fc to block EphA receptors, and after blocking endogenous ephrinB3 ligands in EGFP-IMZ cells with EphB1-Fc. K, Quantitative analysis of the frequency of pure, clustered, and mixed aggregates in different conditions. VZ/SVZ, Ventricular zone/subventricular zone; IMZ, intermediate zone. Scale bars: A, B, 100 μm; F–K, 20 μm. Error bars indicate SEM. ***p < 0.0001, *p < 0.05.
Figure 5.
Figure 5.
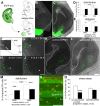
POA-derived interneurons give rise to the superficial migratory stream. A, Schematic illustration of homotopic grafting experiments illustrated in B and C. B, C, Homotopic transplantation of E14 EGFP-POA microexplants to E14 wild-type slices under control conditions (B) and with EphB3-Fc application (5 μg/ml) after 2 d in vitro (C). D, E, Quantitative analysis of the distribution (D) and distance (E) of migrated EGFP-POA cells in the wild-type slices at E14 plus 2 d in vitro under control conditions and with 5 μg/ml EphB3-Fc applied in the medium. F–J, In utero electroporation introducing a GFP-control construct in the POA of E13.5 embryos was performed, followed by time-lapse video capturing of migrating cells in organotypic brain slices 24 h after transfection. K, L, Focal electroporation of a GFP-control construct (K) and a construct containing ephrinB3 shRNA and GFP of POA cells in organotypic slices at E14 after 2 d in vitro (L). M, Quantitative analysis of the distribution of control-transfected and ephrinB3-shRNA transfected POA cells in organotypic slices at E14 plus 2 d in vitro. N, EphrinB3 siRNA transfected (red) and untransfected POA cells on alternating stripes of Alexa 488-labeled EphA4-Fc stripes (green) and unlabeled control lanes at E14 plus 2 div. O, Quantitative analysis of the distribution of control-transfected and ephrinB3-siRNA-transfected dissociated POA-derived cells in alternating stripes of control and EphA4-Fc stripes after 2 d in vitro. POA, Preoptic area; MGE, medial ganglionic eminence; LGE, lateral ganglionic eminence; Ctx, cortex; DMS, deep migratory stream; SMS, superficial migratory stream; SA, striatal anlage; GP, globus pallidus. Scale bars: B, C, K, L, 200 μm; G–J, 100 μm; N, 50 μm. Error bars indicate SEM. ***p < 0.0001.
Figure 6.
Figure 6.
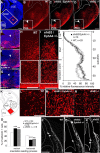
Segregation of POA- and MGE-derived cells is affected in heterozygous efnB3/EphA4 double mutants. A, DAPI staining of a coronally sectioned hemisphere of a wild-type E14 brain. B, Calbindin immunostaining of a coronally sectioned hemisphere of a wild-type E14 brain. C, D, Calbindin immunostaining of a heterozygous efnB3/EphA4a mutant brain (C) and of a homozygous efnB3 knock-out coronal section at E14 (D). The white arrowheads in B–D indicate ectopic cells in the deep aspect of the POA in mutant mice that were absent in the wild types, as magnified in E–G. The white rectangle drawn into the MGE in A, is magnified in H, for the wild type, and in I, an equivalent region from the efnB3/EphA4+/− brain, and was used to plot the profile of the fluorescence intensity. J, The mean relative fluorescence intensity is significantly increased in the transition zone of the mutant mice (illustrated by the red squares in A and K and the white squares in H, I), representing an increased number of calbindin-positive interneurons in that region (ANOVA, F(1,38) = 3.48; ***p < 0.0001). L–O, The orientation of leading processes of interneurons in the transition zone of wild types (L), the efnB3/EphA4+/− (M), and efnB3−/− (N) brain sections was quantitatively analyzed (P). For the quantification of the orientation of the leading processes, the estimated vector from the nucleus to the tip of the leading process for each cell was categorized in four sectors with an angle of 45° as illustrated in the circle in K. Sectors 1 and 3 represent vertical; and sectors 2 and 4, horizontal orientations. O, The frequency of cells with horizontal and vertical orientation was determined as percentage (mean ± SEM) of all cells analyzed and revealed a significant increase in vertically oriented interneurons in the efnB3/EphA4+/− (***p < 0.0001) as well as in the homozygous single knock-outs efnB3−/− (**p < 0.001). P–R, Magnification of the cortices of wild-type (P), the efnB3/EphA4+/− (Q), and the efnB3−/− (R) coronal brain sections stained with an antibody directed against calbindin after photoconversion, to illustrate the distance of interneurons invading the cortex at E14, which was reduced in the knock-out mice. The white arrowheads in P–R indicate the front of migrated interneurons. POA, Preoptic area; MGE, medial ganglionic eminence; LGE, lateral ganglionic eminence; DMS, deep migratory stream; SMS, superficial migratory stream. Scale bars: B–G, 200 μm; H, I, L–N, P–R, 100 μm.
Figure 7.
Figure 7.
Model for the segregation of POA- and MGE-derived interneurons into the superficial and deep migratory stream. MGE-derived interneurons express EphA4 and migrate along the deep route, while interneurons generated in the POA express ephrinB3 and traverse the superficial pathway. EphA4 acts as a ligand for ephrinB3 and induces repulsive reverse signaling in interneurons generated in the POA. In addition to its receptor function, ephrinB3 binds to EphA4 and induces a repellent response in MGE-derived interneurons. Thus, cell–cell contact-mediated repulsive bidirectional ephrinB3/EphA4 signaling in the transition zone of the MGE restricts intermingling of different subsets of interneurons and is involved in sorting these interneuron subtypes in segregated migratory streams.

References

    1. Anderson SA, Eisenstat DD, Shi L, Rubenstein JL. Interneuron migration from basal forebrain to neocortex: dependence on Dlx genes. Science. 1997;278:474–476. - PubMed
    1. Anderson SA, Marín O, Horn C, Jennings K, Rubenstein JL. Distinct cortical migrations from the medial and lateral ganglionic eminences. Development. 2001;128:353–363. - PubMed
    1. Ang ES, Jr, Haydar TF, Gluncic V, Rakic P. Four-dimensional migratory coordinates of GABAergic interneurons in the developing mouse cortex. J Neurosci. 2003;23:5805–5815. - PMC - PubMed
    1. Borrell V, Yoshimura Y, Callaway EM. Targeted gene delivery to telencephalic inhibitory neurons by directional in utero electroporation. J Neurosci Methods. 2005;143:151–158. - PubMed
    1. Butt SJ, Fuccillo M, Nery S, Noctor S, Kriegstein A, Corbin JG, Fishell G. The temporal and spatial origins of cortical interneurons predict their physiological subtype. Neuron. 2005;48:591–604. - PubMed

Publication types