. 2011 Dec 14;31(50):18423-32.
doi: 10.1523/JNEUROSCI.4102-11.2011.

Saccades during object viewing modulate oscillatory phase in the superior temporal sulcus

Affiliations

Saccades during object viewing modulate oscillatory phase in the superior temporal sulcus

Adrian M Bartlett et al. J Neurosci. .

Abstract

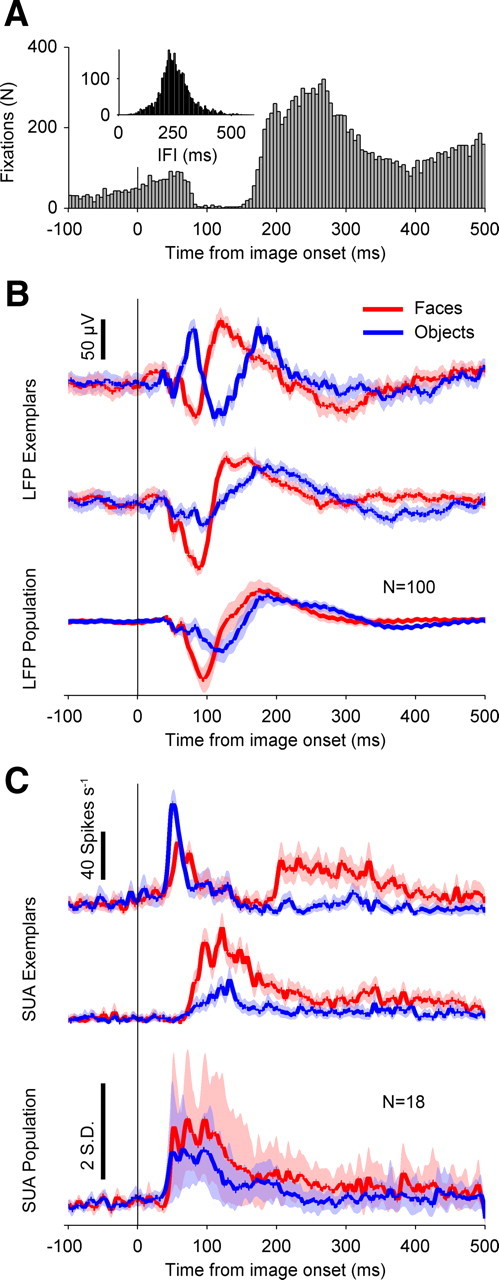
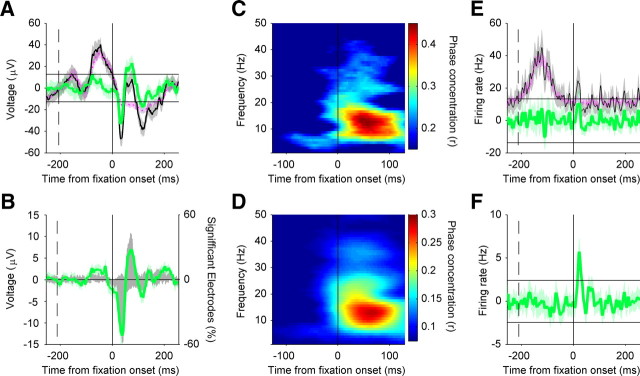
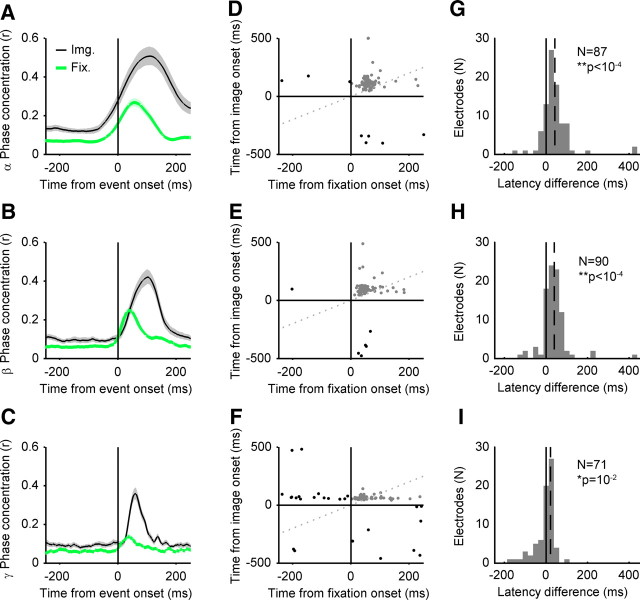
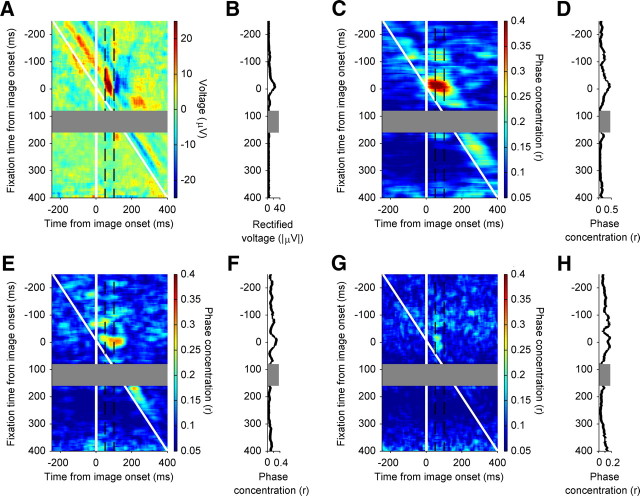
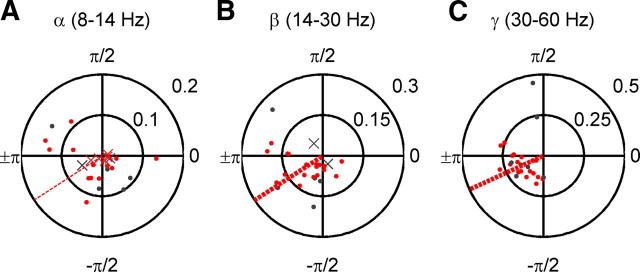
Saccadic eye movements (SEMs) are the primary means of gating visual information in primates and strongly influence visual perception. The active exploration of the visual environment ("active vision") via SEMs produces suppression during saccades and enhancement afterward (i.e., during fixation) in occipital visual areas. In lateral temporal lobe visual areas, the influence, if any, of eye movements is less well understood, despite the necessity of these areas for forming coherent percepts of objects. The upper bank of the superior temporal sulcus (uSTS) is one such area whose sensitivity to SEMs is unknown. We therefore examined how saccades modulate local field potentials (LFPs) in the uSTS of macaque monkeys while they viewed face and nonface object stimuli. LFP phase concentration increased following fixation onset in the alpha (8-14 Hz), beta (14-30 Hz), and gamma (30-60 Hz) bands and was distinct from the image-evoked response. Furthermore, near-coincident onsets of fixation and image presentation--like those occurring in active vision--led to enhanced responses through greater phase concentration in the same frequency bands. Finally, single-unit activity was modulated by the phase of alpha, beta, and gamma oscillations, suggesting that the observed phase-locking influences spike timing in uSTS. Previous research implicates phase concentration in these frequency bands as a correlate of perceptual performance (Womelsdorf et al., 2006; Bosman et al., 2009). Together, these results demonstrate sensitivity to eye movements in an object-processing region of the brain and represent a plausible neural basis for the enhancement of object processing during active vision.


Figures

Figure 1.
Figure 1.
Fixation timing and neural category selectivity. A, Distribution of fixation times relative to image onset, for both monkeys, across all sessions. Bin width is 5 ms. The y-axis is bin count, in number of fixations. For all figures, the vertical solid black line at time 0 indicates image onset, and the x-axis is time relative to image onset, in milliseconds. B, Category-selective LFP responses. The y-axis represents average voltage, in microvolts. The vertical black bar denotes 50 μV. The red traces are mean responses to faces, and the blue traces are mean responses to objects. The top and middle trace pairs are example trial-averaged responses from two electrode sites from the same recording session. The bottom trace is the population average, across both monkeys (N = 100 electrodes). Positive deflections indicate positive voltage polarity. The shaded regions indicate 95% confidence intervals, estimated by bootstrapping (10,000 samples). C, Category-selective SUA activity. The red traces are mean responses to faces, and the blue traces are mean responses to objects. The top and middle trace pairs are example trial-averaged responses from different sessions. For the top two pairs of traces, the y-axis depicts firing rate, in hertz. The top vertical black bar denotes 40 spikes per second. The bottom trace is the population average, across both monkeys (N = 18 visually responsive neurons). For the bottom population trace, the y-axis depicts mean Z-scored firing rates (−100 to 0 ms relative to image onset). The bottom vertical black bar denotes 2 SDs. The shaded regions indicate 95% confidence intervals, estimated by bootstrapping (10,000 samples).
Figure 2.
Figure 2.
Residual neural activity aligned to fixation onset. A, Fixation-locked LFP activity at one electrode site. Mean responses are shown in microvolts as a function of time from fixation onset. The black trace depicts the observed fixation-related activity. The pink trace depicts the mean of the expected (evoked) response to each image example, but aligned according to fixation times. The green trace is the mean-subtracted “residual” activity, or the mean of differences of single-trial observed activity and that expected from the within-example mean. The dashed black vertical lines denote median time of image onset for that recording session. The horizontal black solid lines indicate the nonparametric 95% confidence intervals derived from permutation testing, which accounts for multiple tests across time, for the null hypothesis that the mean-subtracted activity is equal to zero. The shaded regions indicate 95% confidence intervals, estimated by bootstrapping (10,000 samples); shown strictly for visualization purposes. The LFP activity comes from the same electrode site that was used in the top trace of Figure 1B. B, Population summary of fixation-locked LFP activity (N = 96 electrode sites). The green trace depicts the average mean-subtracted LFP activity, in microvolts, with scaling indicated on the left vertical axis. The shaded region indicates 95% confidence intervals, estimated by bootstrapping (10,000 samples), shown strictly for visualization purposes. The gray histogram depicts the percentage of electrodes with mean-subtracted voltage values significantly less than (<0) or greater than (>0) mean voltage values, with scaling indicated on the right vertical axis. The dashed black vertical lines denote median time of image onset over all sessions. C, Phase concentration spectrogram for the electrode site shown in A. The y-axis shows frequency, in hertz. The color bar indicates phase concentration, which is decomposed by frequency band (y-axis; in hertz) and as a function of time from fixation onset (x-axis; in milliseconds; using time windows of 256 and 1 ms step sizes). D, Population average phase concentration spectrogram (N = 96). The conventions are as in C, but based on the spectrogram resulting from the average mean-subtracted LFPs. E, Fixation-locked SUA activity example, as per Figure 2A, but mean firing rate is shown in hertz as a function of time from fixation onset. F, Population average of fixation-locked SUA activity, as per Figure 2A, but mean firing rate is shown in hertz as a function of time from fixation onset.
Figure 3.
Figure 3.
Phase concentration aligned to image onset and fixation onset. A, The black traces depict the population average phase concentration in the alpha band (8–14 Hz), aligned to image onset. The green traces depict the population-average phase concentration of the residual activity aligned to fixation onset. The x-axis shows time from event (fixation or image onset). The y-axis depicts the magnitude of average phase concentration (Rayleigh's r statistic). The shaded regions represent 95% confidence intervals for the population mean, estimated by bootstrapping (10,000 samples). B, As in A, but for the beta band (14–30 Hz). C, As in A, but for the gamma band (30–60 Hz). D, Scatterplot of latency-to-peak phase concentration, for image-locked activity and fixation-locked residual activity in the alpha (8–14 Hz) band at each electrode site. The x-axis depicts time from image onset, and the y-axis depicts time from image onset. The vertical and horizontal axes depict the time of fixation/image onset, respectively. The oblique dotted gray line represents the line of equality (equal latency for both reference frames). Each dot represents latency from a single electrode site. Electrode sites showing postevent peaks in both reference frames are shown in gray and are included in the latency comparison analysis (G–I). Electrodes showing preevent peaks in either reference frame are shown in black and are not included in the latency comparison analysis (G–I). E, As D, but for the beta (14–30 Hz) band. F, As D, but for the gamma (30–60 Hz) band. G, Histogram of differences between image-evoked and fixation-evoked peak phase concentration in the alpha (8–14 Hz) band, for electrodes showing both postfixation onset and postimage onset peak latencies (G–I, gray dots in top right quadrant). The x-axis depicts peak latency differences (image onset minus fixation onset latencies). The negative values indicate shorter latency peak responses in the image-locked reference frame, and the positive values indicate shorter latency peak responses in the fixation-locked reference frame. Histogram bin sizes are 25 ms. The y-axis depicts frequency of occurrence, in number of electrode sites. The solid black vertical line depicts no difference in peak latency. The dashed black line represents the median peak latency difference of the distribution. The insets are the number of electrodes included in the analysis (N) and the p value from a paired Wilcoxon sign-rank test on latency values. H, As G, but for the beta (14–30 Hz) band. I, As G, but for the gamma (30–60 Hz) band.
Figure 4.
Figure 4.
Interaction of image-evoked and fixation-evoked activity. A, Residual evoked response, in millivolts, as a function of absolute time from image onset and the relative timing of image onset and visual fixations. The horizontal axis depicts the absolute time from image onset, in milliseconds. The vertical axis depicts the relative timing between fixation onset and image onset, in milliseconds. Negative y-axis values indicate fixation preceding image onset. The vertical white solid line indicates the time of image onset. The oblique white solid line indicates the time of fixation onset. The gray dashed vertical lines enclose the time interval used to calculate the image-evoked modulation functions in B. The color bar represents mean residual voltage. The cooler colors are lower residual voltage values, and the warmer colors are high residual voltage values. The gray rectangular region, spanning fixation times from image onset 80–160 ms, are omitted from the plots and all analyses due to insufficient sample size. B, Image-evoked response modulation functions. The y-axis depicts the relative timing between fixation onset and image onset, in milliseconds. The x-axis represents mean rectified residual voltage, in absolute millivolts. The gray rectangle represents relative fixation times at which we had insufficient samples to compute reliable statistics. C, Residual phase concentration in the alpha (8–14 Hz) band, as a function of absolute time from image onset and the relative timing of image onset and visual fixations. The horizontal axis depicts the absolute time from image onset, in milliseconds. The vertical axis depicts the relative timing between fixation onset and image onset, in milliseconds. Negative y-axis values indicate fixation preceding image onset. The vertical white solid line indicates the time of image onset. The oblique white solid line indicates the time of fixation onset. The gray dashed vertical lines enclose the time interval used to calculate the image-evoked modulation functions in D. The color bar represents phase concentration (Rayleigh's r). Cooler colors are lower residual phase concentration values, and warmer colors are high phase concentration values. The gray rectangular region, spanning fixation times from image onset 80–160 ms, are omitted from the plots and all analyses due to insufficient sample size. D, Image-evoked response modulation functions. The y-axis depicts the relative timing between fixation onset and image onset, in milliseconds. The x-axis represents phase concentration magnitude (Rayleigh's r). The gray rectangle represents relative fixation times at which we had insufficient samples to compute reliable statistics. E, As C, but for the beta (14–30 Hz) band. F, As D, but for the beta (14–30 Hz) band. Note the different x-axis phase concentration scale. G, As C, but for the gamma (30–60 Hz) band. H, As D, but for the gamma (30–60 Hz) band. Note the different x-axis phase concentration scale.
Figure 5.
Figure 5.
Preferred phases of firing among uSTS neurons. A, Alpha (8–14 Hz) preferred phases. Each dot represents results from a single neuron. Data are presented in polar form. The angle, counterclockwise from phase = 0 (far right), represents the preferred phase of firing of a neuron. Eccentricity from the center represents the magnitude of phase locking (Rayleigh's r statistic). The red symbols are visually responsive neurons, and the gray dots are visually unresponsive neurons. The dots represent neurons with a significant preferred phase of firing (p < 10−4, Rayleigh's test for circular nonuniformity), and x's are nonsignificantly phase-locked neurons. The dashed red line depicts the mean preferred phase of firing for all significantly phase-locked visually responsive neurons. The thin lines are for not significant mean preferred phases of firing, and the thick lines are for significant mean preferred phases of firing (p < 10−4, second-order Rayleigh's test). B, As A, but for the beta (14–30 Hz) band. C, As A, but for the gamma (30–60 Hz) band.

Similar articles

Cited by

References

    1. Afraz SR, Kiani R, Esteky H. Microstimulation of inferotemporal cortex influences face categorization. Nature. 2006;442:692–695. - PubMed
    1. Anastassiou CA, Montgomery SM, Barahona M, Buzsáki G, Koch C. The effect of spatially inhomogeneous extracellular electric fields on neurons. J Neurosci. 2010;30:1925–1936. - PMC - PubMed
    1. Anastassiou CA, Perin R, Markram H, Koch C. Ephaptic coupling of cortical neurons. Nat Neurosci. 2011;14:217–223. - PubMed
    1. Azouz R, Gray CM. Cellular mechanisms contributing to response variability of cortical neurons in vivo. J Neurosci. 1999;19:2209–2223. - PMC - PubMed
    1. Baylis GC, Rolls ET, Leonard CM. Functional subdivisions of the temporal lobe neocortex. J Neurosci. 1987;7:330–342. - PMC - PubMed

Publication types

LinkOut - more resources