. 2011 Dec 14;31(50):18568-77.
doi: 10.1523/JNEUROSCI.3768-11.2011.

Ceruloplasmin oxidation, a feature of Parkinson's disease CSF, inhibits ferroxidase activity and promotes cellular iron retention

Affiliations

Ceruloplasmin oxidation, a feature of Parkinson's disease CSF, inhibits ferroxidase activity and promotes cellular iron retention

Stefano Olivieri et al. J Neurosci. .

Abstract

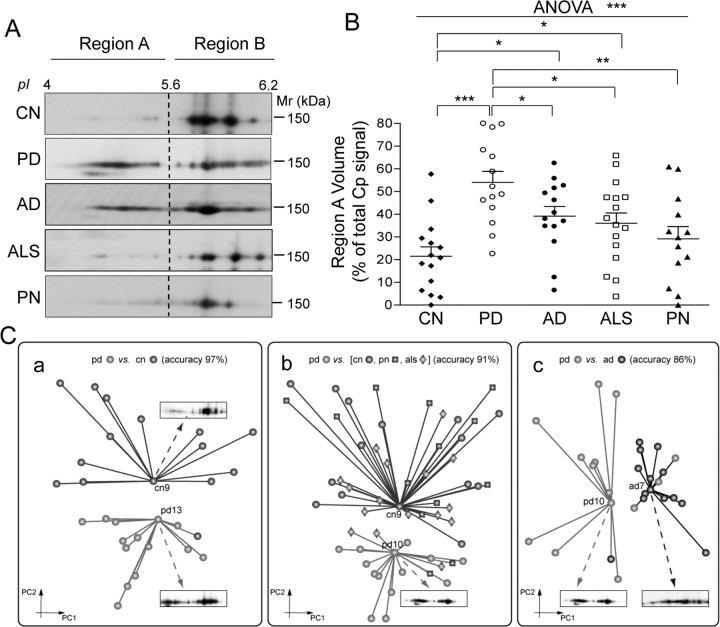
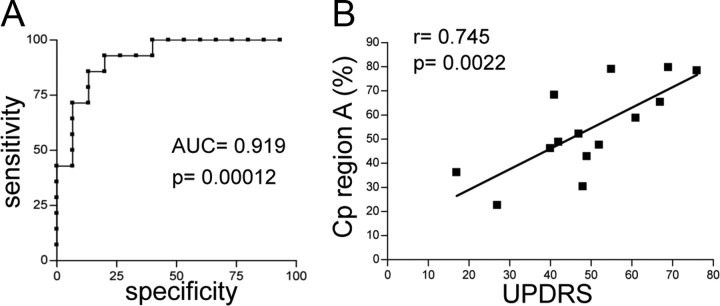
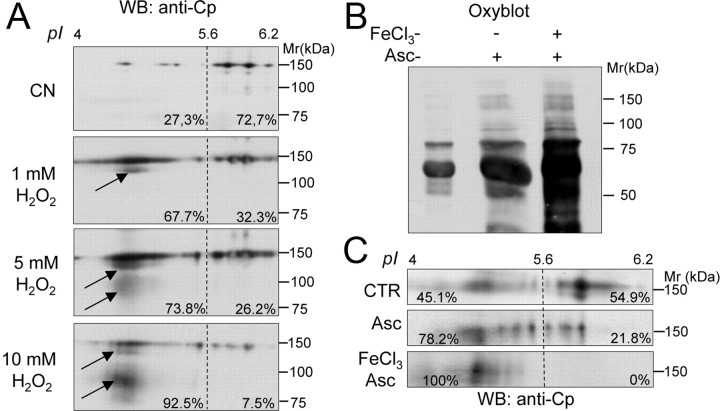
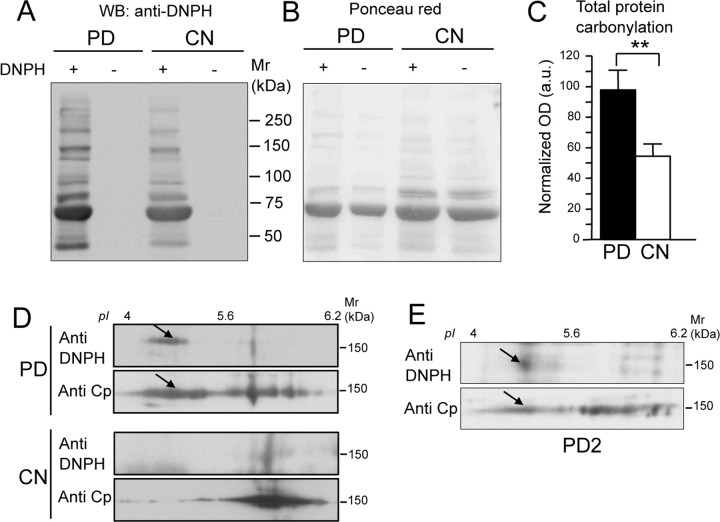
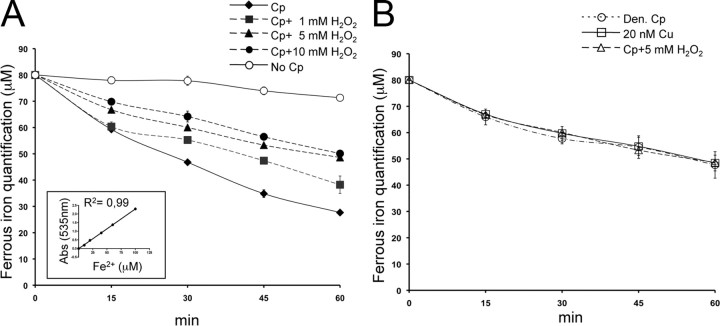
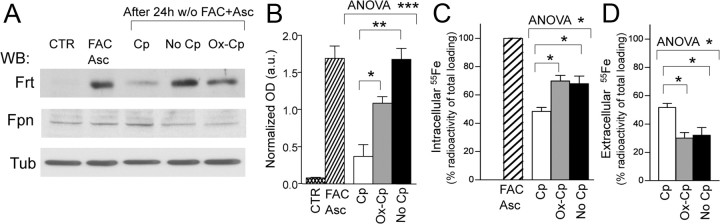
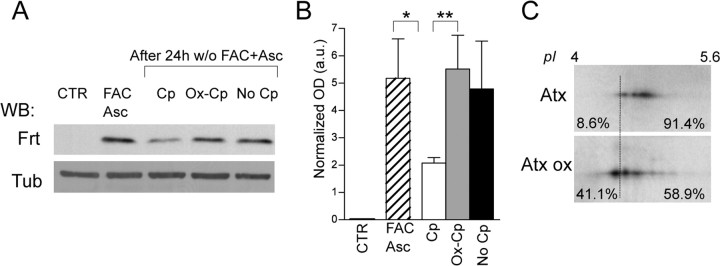
Parkinson's disease is a neurodegenerative disorder characterized by oxidative stress and CNS iron deposition. Ceruloplasmin is an extracellular ferroxidase that regulates cellular iron loading and export, and hence protects tissues from oxidative damage. Using two-dimensional electrophoresis, we investigated ceruloplasmin patterns in the CSF of human Parkinson's disease patients. Parkinson's disease ceruloplasmin profiles proved more acidic than those found in healthy controls and in other human neurological diseases (peripheral neuropathies, amyotrophic lateral sclerosis, and Alzheimer's disease); degrees of acidity correlated with patients' pathological grading. Applying an unsupervised pattern recognition procedure to the two-dimensional electrophoresis images, we identified representative pathological clusters. In vitro oxidation of CSF in two-dimensional electrophoresis generated a ceruloplasmin shift resembling that observed in Parkinson's disease and co-occurred with an increase in protein carbonylation. Likewise, increased protein carbonylation was observed in Parkinson's disease CSF, and the same modification was directly identified in these samples on ceruloplasmin. These results indicate that ceruloplasmin oxidation contributes to pattern modification in Parkinson's disease. From the functional point of view, ceruloplasmin oxidation caused a decrease in ferroxidase activity, which in turn promotes intracellular iron retention in neuronal cell lines as well as in primary neurons, which are more sensitive to iron accumulation. Accordingly, the presence of oxidized ceruloplasmin in Parkinson's disease CSF might be used as a marker for oxidative damage and might provide new insights into the underlying pathological mechanisms.


Figures

Figure 1.
Figure 1.
CSF Cp 2DE profile discriminates PD from AD, ALS, PN, and CN. A, Representative results for WB analysis performed with anti-Cp on 2DE-resolved proteins. On the basis of pI threshold value, Cp signal distribution was divided into two distinct areas, regions A and B. B, Analysis of WB signal optical density value distribution in region A, evaluated as a percentage of the total Cp signal. Data were analyzed both by Student's t test and by ANOVA. Single patient distributions as well as means and SE are shown (PD, n = 14; CN, n = 15; AD, n = 14; ALS, n = 16; PN, n = 13) (*p < 0.05; **p < 0.005; ***p < 0.001). C, Unsupervised cluster identification discriminates Cp pattern of PD patients from other groups. Dimensionality reduction of the anti-Cp WB images data set executed by principal component analysis (the first two principal components, PC1 and PC2, are shown), and clusters of homogeneous subjects were identified by unsupervised minimum curvilinear affinity propagation clustering analysis. Light gray clusters are for PD attribution, and dark gray and black clusters for non-PD attribution. Markers associated with sample names indicate the exemplars for the respective cluster. An original 2DE-WB image is displayed for each exemplar. a, Clustering of PD and CN. Sample cn13 proved to be misclassified. b, Clustering of PD, CN, PN, and ALS subjects. Five of 58 samples were misclassified, from left to right, als7, als5, pn4, als10, pn6. c, Clustering of PD and AD patients. Four of 28 samples proved to be misclassified (from left to right, ad8, pd13, pd14, pd11).
Figure 2.
Figure 2.
Cp pattern acidification discriminates healthy subjects and correlates with Parkinson's disease grading. A, The ROC curve was used to define the ability of the assay to discriminate between PD and CN groups, and to define the threshold value at which OD gave the best ratio between sensitivity and specificity. PD versus CN showed an area under the curve (AUC) of 0.919 with p = 0.00012. A signal cutoff value in region A >46.02% enabled discrimination of PD from CN patients with a sensitivity of 71.4% and a specificity of 93.3%. B, Correlation analysis was evaluated as Pearson's coefficient (r) between Cp signal in region A (as a percentage of total WB Cp signal) and PD clinical status (as UPDRS score) for each patient. UPDRS and Cp signal in region A values passed the normality test for Gaussian distribution as assessed by Kolmogorov–Smirnov test. Correlation showed a coefficient r = 0.745 with p = 0.0022.
Figure 3.
Figure 3.
In vitro oxidative stress induces Cp to convert to acidic isoforms and total CSF protein carbonylation to increase. A, WB analysis of Cp profile in the CSF from a representative CN subject resolved by 2DE under resting conditions or after treatment with increasing amounts of H2O2 (1, 5, 10 mm); percentages indicate the amount of total Cp signal present in regions A and B (Fig. 1); the arrows indicate low-molecular-weight products generated by protein oxidation. B, Detection of protein carbonylation by OxyBlot assay on total CSF proteins resolved by SDS-PAGE and stained for carbonyl groups, under resting conditions or after oxidation obtained by treatment with Asc with or without ferrous chloride (FeCl3). C, WB analysis of 2DE Cp profile in the CSF under resting conditions or after oxidation treatments as in B; percentages indicate total Cp signal present in regions A and B (Fig. 1).
Figure 4.
Figure 4.
CSF total protein carbonylation is increased in PD patients and Cp is a carbonylation target. A, Representative gel of OxyBlot assay for carbonyl group detection. CSF total proteins from PD patients and healthy subjects (CN) were resolved by SDS-PAGE either after derivatization with DNPH (+) or without derivatization (−), and analyzed by WB with anti-DNPH for carbonylation detection. B, Ponceau red staining of the nitrocellulose used for OxyBlot assay shows that proteins were loaded in equal amounts. C, Evaluation of total protein carbonylation detected in the CSF of PD patients (n = 14) and CN subjects (n = 15): the y-axis indicates OxyBlot signal OD values (in arbitrary units) normalized by total protein loading. Data were analyzed by Student's t test; means with SE are indicated (**p < 0.005). D, CSF proteins from both the PD patient pool and the CN subject pool were resolved by 2DE after derivatization with DNPH. Carbonylation was revealed with anti-DNPH antibody, and the same nitrocellulose membrane was further stained with anti-Cp to detect signal colocalization. E, The same analysis as in D, performed on a single PD patient (PD2), from whom greater amounts of CSF had by chance been collected showed identical results. The arrows indicate the colocalization of carbonylated spots with Cp acidic spots.
Figure 5.
Figure 5.
Oxidation decreases Cp ferroxidase activity. A, Ferroxidase activity was analyzed by Btp assay. Purified Cp (1.25 μg) was incubated with 60 μm FeCl3 (ferrous form) and analyzed at five different times (0, 15, 30, 45, 60 min) with a solution of 1 mm Btp. The decrease in absorbance at 535 nm of Btp-Fe2+ complex is due to ferrous iron oxidation into ferric form (Fe3+). Ferroxidase activity was also analyzed after oxidation by H2O2 treatments (1, 5, 10 mm). By way of control, the assay was performed in the presence of buffer alone (No Cp). Means with SE are indicated (n = 5). The inset shows linear regression of the Btp-Fe2+ complex optical density at 535 nm with different Fe2+ micromolar concentrations. B, Btp assay performed with Cp after 50 mm H2O2 treatments, with heat-denatured Cp (Den Cp), and with buffer alone containing 20 nm Cu2+, the concentration reached by the Cu released from 1.25 μg of denatured Cp.
Figure 6.
Figure 6.
Extracellular oxidized Cp favors intracellular iron accumulation. A, SH-SY5Y neuroblastoma cells maintained in medium supplemented with 10% FBS (CTR) were iron loaded by treatment (20 h) with FAC (100 μm) and Asc (200 μm). Extracellular iron and ascorbate were subsequently removed (w/o FAC+Asc) and cells further incubated (24 h) in the medium alone without serum (No Cp) or in the presence either of functional Cp (5 μg/ml) or of inactive oxidized Cp (Ox-Cp). Cell lysates resolved by SDS-PAGE were used for WB performed with anti-Ferritin (Frt) and anti-Ferroportin (Fpn); reactivity of anti-β-tubulin (Tub) was used for signal normalization. B, Analysis of Ferritin OD normalized signals (in arbitrary units) in treated SH-SY5Y. C, Evaluation of Fe retained in the cells. SH-SY5Y cells were iron loaded as previously described but with 95 μm FAC supplemented with 55Fe-citrate (5 μm) as a tracer. After 20 h incubation, the cells were washed, and one aliquot (2 × 10⁵ cells/well, in triplicate) was kept for 100% iron-loading evaluation (FAC), while other aliquots were further incubated (24 h) in serum-free medium alone (No Cp), or in the presence either of functional Cp or of inactive oxidized Cp (Ox-Cp). Cells were then washed, lysed, and counted. Radioactive counts per minute in each well (in triplicate for each condition) were normalized on the basis of total protein contents and used to evaluate the differences in percentages of total intracellular iron contents. D, Evaluation of Fe released by the cells. Spent media after 24 h incubation in serum-free medium alone (No Cp), or in the presence either of functional Cp or of inactive oxidized Cp (Ox-Cp), were collected and counted. Radioactive counts per minute of medium from each well (in triplicate for each condition) were used for the calculation of percentages of iron released from total intracellular iron loading. Data in B–D were analyzed by both unpaired ANOVA and Student's t test; respective means with SE of five (B) and three (C, D) independent experiments are indicated (p values: *p < 0.05; **p < 0.005; ***p < 0.0001).
Figure 7.
Figure 7.
Extracellular oxidized Cp favors intracellular iron accumulation in primary neuron. A, Rat primary hippocampal neurons maintained in medium supplemented with 5% FBS (CTR) were iron loaded by treatment (20 h) with FAC (100 μm) and Asc (200 μm). Extracellular iron and ascorbate were subsequently removed (w/o FAC+Asc) and cells further incubated (24 h) in the medium with low serum (1.25% derived from the presence of neuronal culture conditioned medium) in the absence (No Cp) or in the presence either of functional Cp (5 μg/ml) or of inactive oxidized Cp (Ox-Cp). Cell lysates resolved by SDS-PAGE were used for WB performed with anti-Ferritin (Frt); reactivity of anti-βIII-tubulin (Tub) was used for signal normalization. B, Analysis of Ferritin OD normalized signals (in arbitrary units) in rat primary hippocampal neuron culture. C, Membrane anchored GPI-Cp expressed by astrocytes undergo oxidative modifications. Pure primary rat astrocytes (Atx) were exposed to oxidation (1 h at 0.6 mm H2O2) (Atx ox), and GPI-Cp 2DE pattern profile was analyzed by 2DE and by WB performed with anti-Cp. Percentages indicate the amount of total Cp signal present in the regions defined by the threshold line. The data in B were analyzed by Mann–Whitney test; means with SE of five independent experiments are indicated (p values: *p < 0.05; **p < 0.005; ***p < 0.0001).

Similar articles

Cited by

References

    1. Baraj B, Cortina JL, Sastre A, Granados M. Copper interference on spectrophotometric determination of iron and their simultaneous determination using bathophenantroline-disulfonic acid disodium salt. Fresenius J Anal Chem. 1998;360:263–265.
    1. Bettegazzi B, Mihailovich M, Di Cesare A, Consonni A, Macco R, Pelizzoni I, Codazzi F, Grohovaz F, Zacchetti D. beta-Secretase activity in rat astrocytes: translational block of BACE1 and modulation of BACE2 expression. Eur J Neurosci. 2011;33:236–243. - PubMed
    1. Bharucha KJ, Friedman JK, Vincent AS, Ross ED. Lower serum ceruloplasmin levels correlate with younger age of onset in Parkinson's disease. J Neurol. 2008;255:1957–1962. - PubMed
    1. Boll MC, Sotelo J, Otero E, Alcaraz-Zubeldia M, Rios C. Reduced ferroxidase activity in the cerebrospinal fluid from patients with Parkinson's disease. Neurosci Lett. 1999;265:155–158. - PubMed
    1. Boll MC, Alcaraz-Zubeldia M, Montes S, Rios C. Free copper, ferroxidase and SOD1 activities, lipid peroxidation and NO(x) content in the CSF. A different marker profile in four neurodegenerative diseases. Neurochem Res. 2008;33:1717–1723. - PubMed

Publication types