. 2011 Dec 14;31(50):18606-17.
doi: 10.1523/JNEUROSCI.2578-11.2011.

Specific protein kinase C isoforms are required for rod photoreceptor differentiation

Affiliations

Specific protein kinase C isoforms are required for rod photoreceptor differentiation

Carolina Pinzon-Guzman et al. J Neurosci. .

Abstract

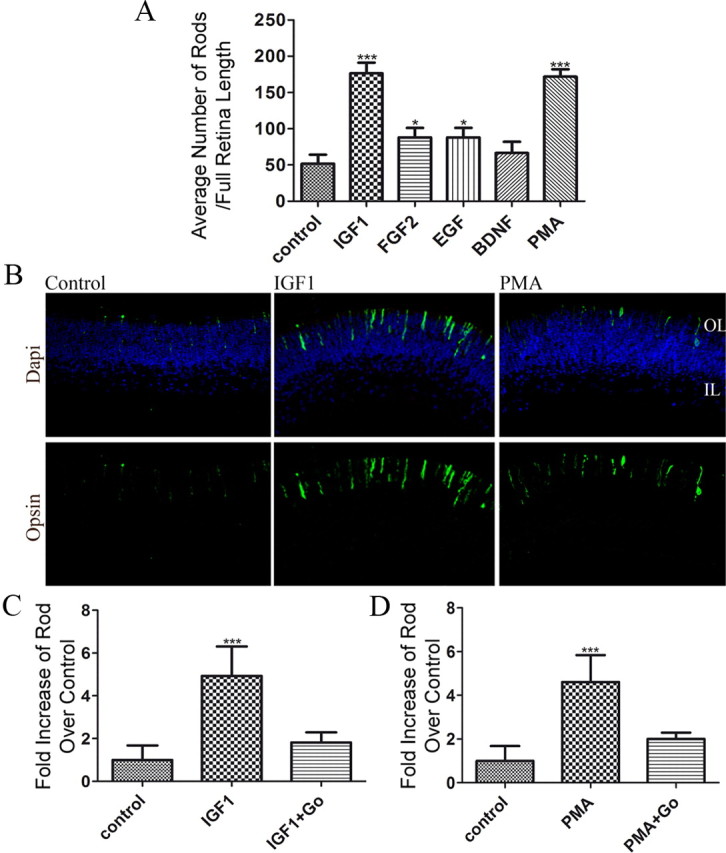
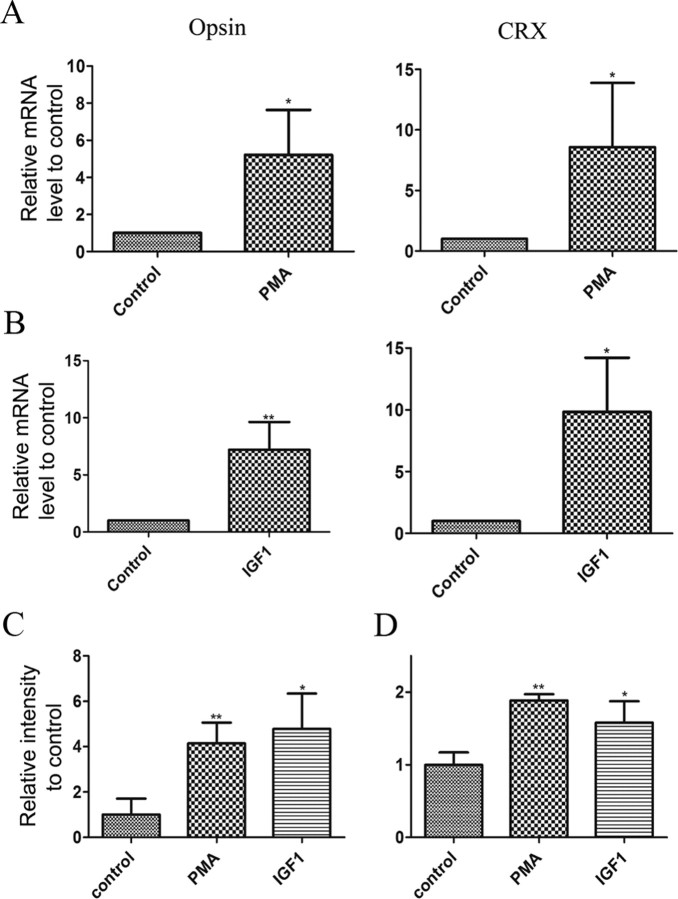
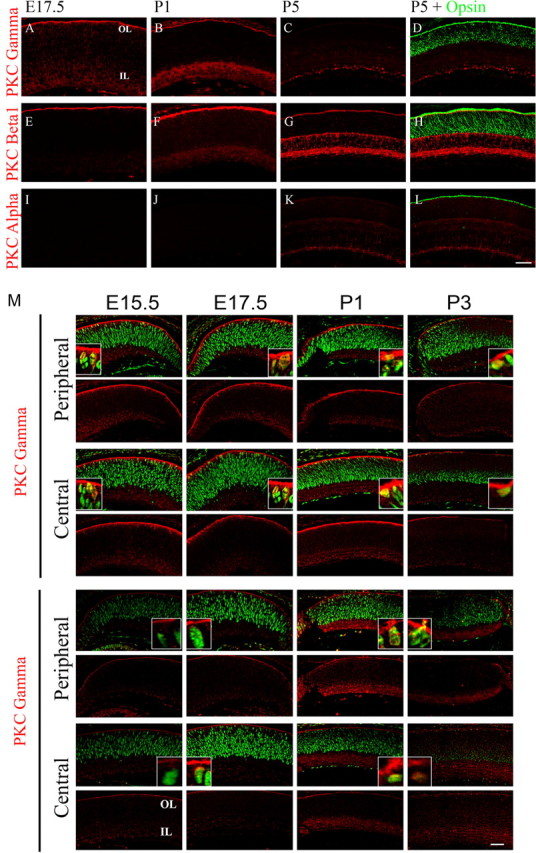
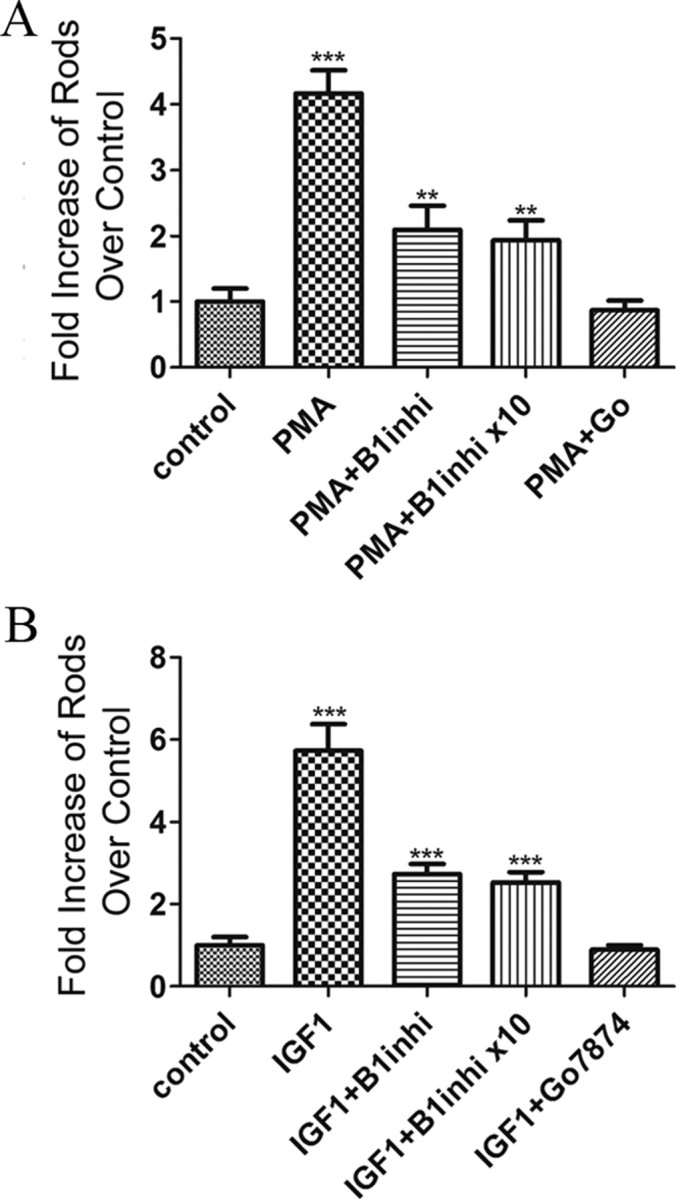
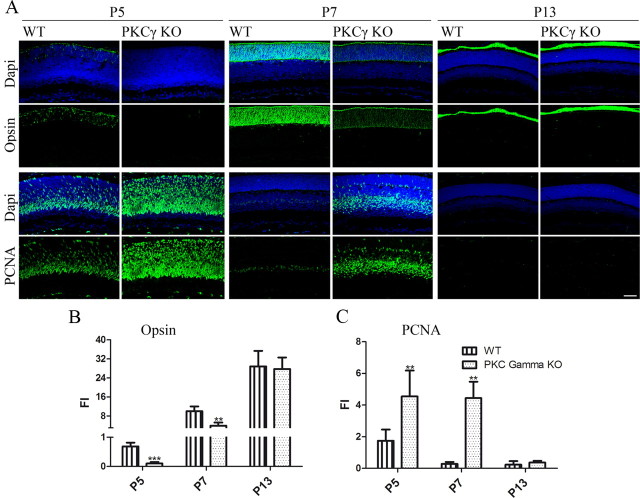
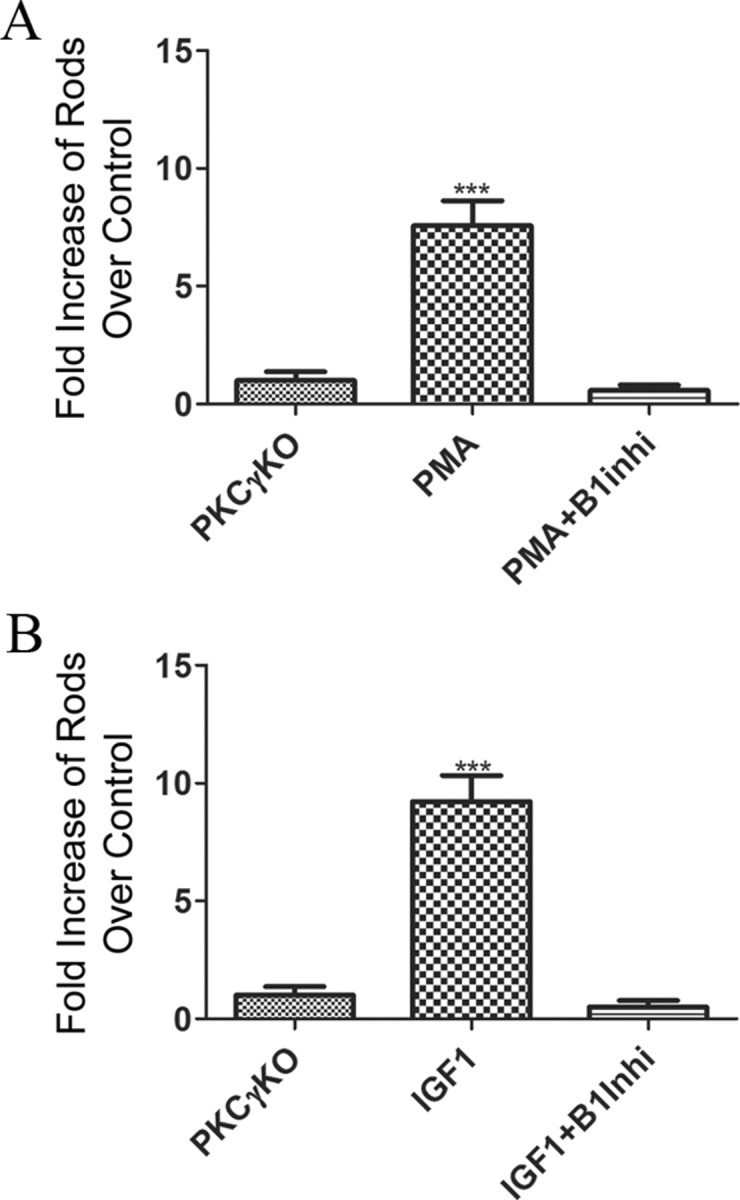
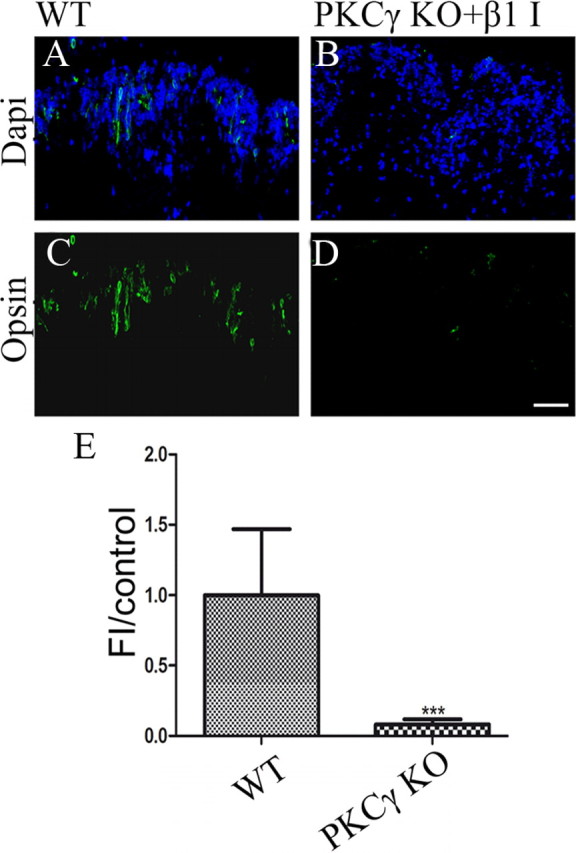
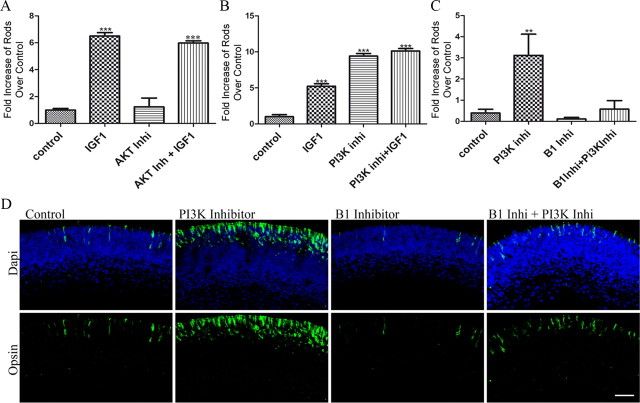
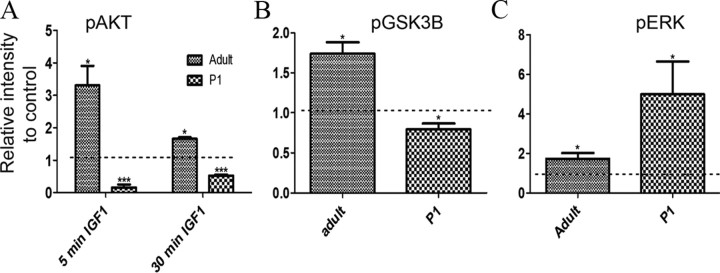
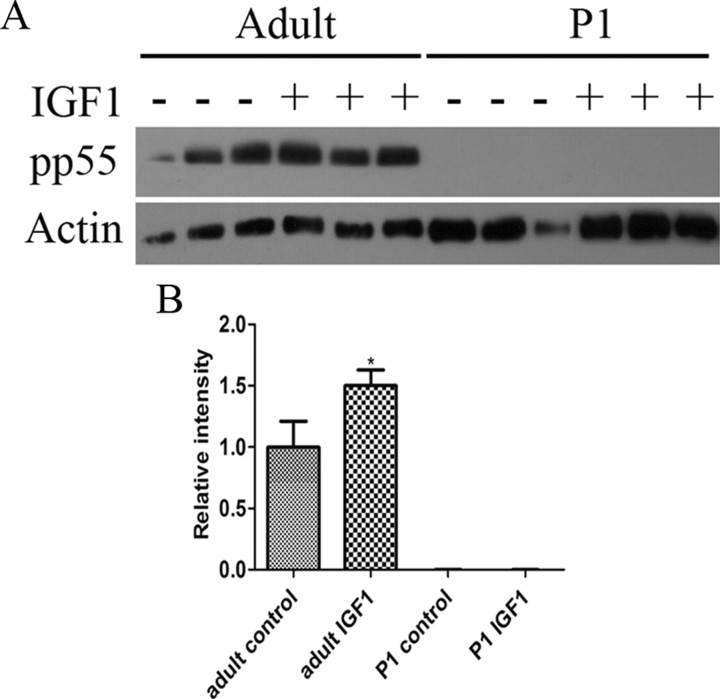
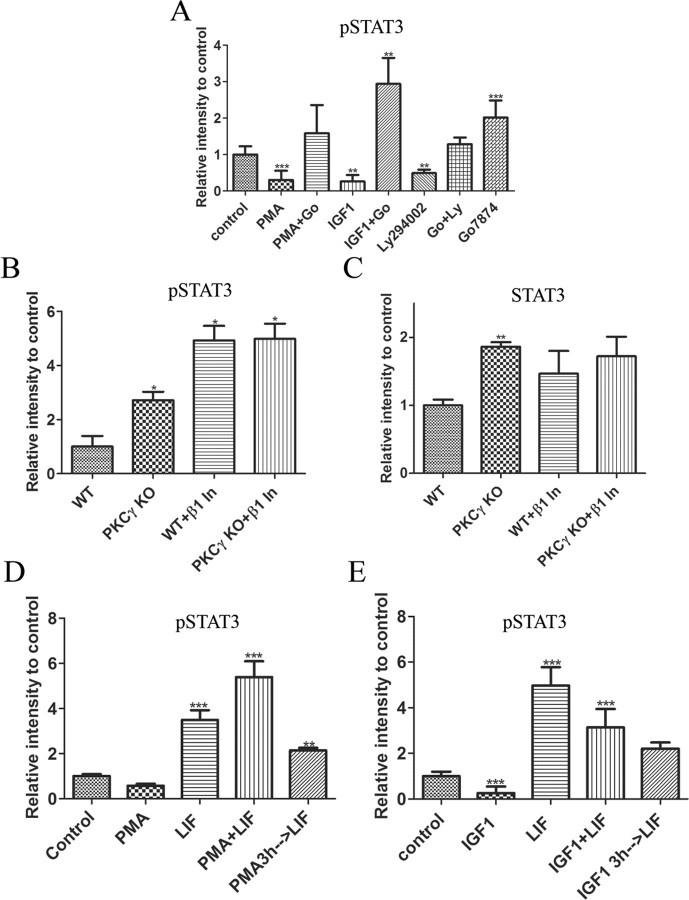
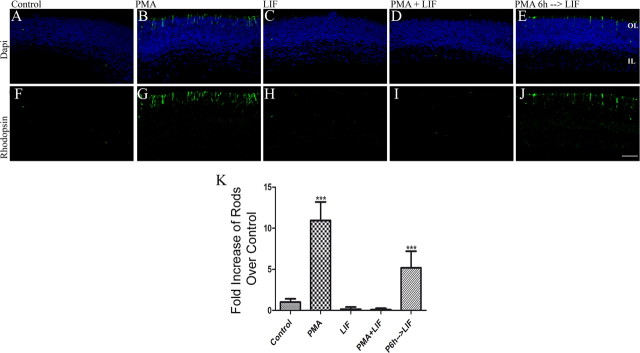
The protein kinase C (PKC) family of enzymes regulates cell physiology through phosphorylation of serine and threonine residues of many proteins in most cell types. Here we identify PKC-β1 and PKC-γ as isoforms that are essential for rod photoreceptor differentiation in mouse retinas. Using ex vivo retinal explants, we found that phorbol ester 12-myristate 13-acetate and insulin-like growth factor 1 (IGF1) induced rod differentiation, as defined by opsin or Crx expression, in a PKC-dependent manner days ahead of rod development in untreated explants. PKC-β1 and PKC-γ were colocalized with proliferating cell nuclear antigen (PCNA)- and STAT3-positive progenitors through the later differentiation period. Pharmacological or genetic inhibition of either isoform resulted in a partial reduction in the appearance of rods, whereas removing both isoforms resulted in their complete absence. Furthermore, a significant decline of STAT3 tyrosine phosphorylation was observed by activation of PKC, while inhibition of PKC resulted in an increase of phosphorylated STAT3 along with a delayed cell cycle exit of progenitors with prolonged PCNA expression. In adult retinas, IGF1 activates PI-3 kinase (PI3K), but in neonatal retinas its action is identical to the action of an PI3K inhibitor. These data unveil a novel signaling cascade that coordinates and regulates rod differentiation through specific PKC isoforms in mammals.


Figures

Figure 1.
Figure 1.
IGF1 and PMA increase the number of rod photoreceptors present in P1 retinal explants by activating PKC. A, Numbers of rods present on P1 retinas after 4 d of culture in the presence of 50 ng/ml IGF1, 100 nm FGF2, 100 nm EGF, 100 nm BDNF, or 100 nm PMA. Counts were obtained by averaging the number of rods present in three individual histological cross-sections of each retina. At least three different retinas were studied per treatment focusing on the central areas of the retina. B, Immunofluorescence detection of opsin (green) overlaid with nuclear counterstain (Hoechst, blue) of 4 d P1 retinal explants. P1 retinas were cultured from WT mice for 4 d in the presence of 50 ng/ml IGF1 or 100 nm PMA. OL, Outer retinal layer; IL, Inner retinal layer. C, D, Numbers of rods present at the end of a 4 d culture of P1 WT retinas in the presence of 50 ng/ml IGF1 (C), 100 nM PMA (D), or 100 nM Go7874 (C, D). *p < 0.05, ***p < 0.0001. Error bars indicate SEM.
Figure 2.
Figure 2.
IGF1 and PMA treatment of P1 retinal explants increases expression of rod specific genes. A, B, Quantitative RT-PCR assay showing expression of opsin and Crx in P1 retinal explants cultured for 4 d in the presence of PMA (A) or IGF1 (B). *p < 0.05; **p < 0.005. Beta-actin and GAPDH expression was used to normalize mRNA levels and values are expressed relative to control levels. C, D, Amount of opsin (C) and Crx (D) proteins found in 4 d retinal explants of P1 retinas using Western blot analysis. Beta-actin expression was used to normalize total protein levels. Values in graph are normalized to control levels. *p < 0.05, **p < 0.01. Error bars indicate SEM.
Figure 3.
Figure 3.
PKC-β1 and PKC-γ isoforms are expressed during retinal development. A–L, Immunofluorescent detection of PKC-α, PKC-β1, and PKC-γ (red) from E17.5 (A, E, I), P1 (B, F, J), P5 (C, G, K) and colocalization with opsin (green) expression at P5 (D, K, L). M, Expression of PKC-β1 and PKC-γ (red) colocalization with PCNA (green) in the central and peripheral retina of E15.5, E17.5, P1, and P3 retinas. OL, Outer retinal layer; IL, inner retinal layer. Scale bar, 40 μm.
Figure 4.
Figure 4.
Inhibition of PCK-β1 activity partially inhibits the effect of PMA and IGF1 on rod photoreceptor formation. A, B, Increase in rods present at the end of a 4 d culture of P1 retinas after addition of PMA (A) and IGF1 (B) in the presence or absence of PCK-β1-specific inhibitor (B1inhi; 30 or 300 nm) or 100 nm PKC pan inhibitor (Go7874) relative to untreated explants. Values were obtained by averaging the number of rods present in three individual section of a single retina. At least three different retinas were studied per treatment. **p < 0.005; ***p < 0.001. Error bars indicate SEM.
Figure 5.
Figure 5.
Absence of PKC-γ during retinal development causes a delay in rod formation and prolongs progenitor cell cycle exit. A, Immunofluorescence detection of opsin and PCNA (green) of PKC-γ KO and WT littermate retinas of ages P5, P7, and P13. Sections were overlaid with nuclear counterstain (Hoechst blue). B, Fluorescence intensity of opsin present in retinas at ages P5, P7, and P13, comparing PKC-γ KO retinas to wild-type littermates. C, Fluorescence intensity of PCNA present in the outer layer of the retinas at ages P5, P7, and P13, comparing PKC-γ KO retinas to wild-type littermates. The outer plexiform layer defined the limit between outer and inner layers of the retina. **p < 0.01; ***p < 0.005. Values were obtained by averaging the fluorescence intensity of at least three representative areas of at least three different retinas. Scale bar, 40 μm. Error bars indicate SEM.
Figure 6.
Figure 6.
In the absence of PKC-β1 or PKC-γ, neither PMA nor IGF1 can induce rod photoreceptor formation. A, Increase in rods present at the end of a 4 d culture of P1 PKC-γ KO retinas in the presence of 100 nm of PMA and PMA plus 30 nm PKC-β1 inhibitor relative to untreated explants. B, Increase in rods present at the end of a 4 d culture of PKC-γ KO retinas in the presence of 50 ng/ml IGF1 or IGF1 and 30 nm PKC-β1 inhibitor. Cell counts were obtained from four retinas for each treatment. Error bars indicate SEM.
Figure 7.
Figure 7.
Absence of PKC-β1 and PKC-γ isoforms during retinal development inhibits rod photoreceptor formation. A–D, Immunofluorescence detection of opsin (green) in P1 retinas after 8 d culture of PKC-γ KO and WT littermates in the presence of PKC-β1 inhibitor. Sections were overlaid with nuclear counterstain (Hoechst blue). E, Fluorescence intensity of rhodopsin present in P1 retinas after 8 d culture of PKC-γ KO and WT littermates in the presence of PKC-β1 inhibitor. ***p < 0.009. Values were obtained by averaging the fluorescence intensity of at least three representative areas of at least three retinas. Scale bar, 40 μm. Error bars indicate SEM.
Figure 8.
Figure 8.
IGF1 activates PKC by inhibiting PI3K activity. A, Number of rods found in P1 WT retinas at the end of a 4 d culture in the presence of 50 ng/ml IGF1 and 500 nm Akt inhibitor VIII. B, Number of rods found in P1 WT retinas at the end of a 4 d culture in the presence of IGF1, 50 μm Ly294002, and combination compared to controls. C, Number of rods found in PKC-γ KO P1 retinas at the end of a 4 d culture in the presence of Ly294002, PCK-β1 inhibitor, and a combination of the two expressed as a ratio to the number in untreated controls. Total number of rods was counted from at least three cross sections of a single treated retina. At least three retinas were studied, and the average was plotted. **p < 0.01; ***p < 0.001. D, Immunofluorescence detection of opsin (green) in PKC-γ KO P1 retinas after 4 d of culture in the presence of 50 μm Ly294002, 30 nm PCK-β1 inhibitor, and a combination. Scale bar, 40 μm. Error bars indicate SEM.
Figure 9.
Figure 9.
IGF1 treatment of P1 and adult retinas results in opposite effects on phosphorylation of Akt and GSK3β. A, Amount of phosphorylated Ser 473 Akt found in adult and P1 WT retinas after 5 and 30 min treatment with 50 ng/ml IGF1. B, Amount of phosphorylated Ser 9 GSK3β found in adult and P1 WT retinas after 5 min treatment with 50 ng/ml IGF1. C, Amount of phosphorylated Tyr 204 ERK found in adult and P1 WT retinas after 5 min treatment with 50 ng/ml IGF1. *p < 0.05; ***p < 0.005 versus control. Dotted lines depict the levels of untreated retinas. At least three retinas were studied per condition. Error bars indicate SEM.
Figure 10.
Figure 10.
In P1 retinas, IGF1 does not phosphorylate the regulatory domain of PI3K. A, Western blot with phosphorylated p55 in P1 and adult retinas under control conditions and after 5 min treatment with IGF1. B, Histogram of normalized band intensities of pp55. *p < 0.05 versus control. At least three retinas were studied per condition. Error bars indicate SEM.
Figure 11.
Figure 11.
PKC activation inhibits LIF-induced STAT3 tyrosine phosphorylation. A, Amount of tyrosine-phosphorylated STAT3 found in P1 WT retinas after 5 h explant culture followed by 30 min treatment with 100 nm PMA, 50 ng/ml IGF1, 100 nm Go7874, and 50 μm Ly294002. B, C, Amount of tyrosine phosphorylated STAT3 (B) and total STAT3 (C) found in retinas of P1 PKC-γ KO and WT littermates cultured for 5 h in the presence or absence of PCK-β1 inhibitor. D, E, Amount of tyrosine-phosphorylated STAT3 found in P1 WT retinas after 5 h explant culture followed by 3 h preincubation with either PMA (D) or IGF1 (E) with subsequent addition of LIF for 30 min. *p < 0.05; **p < 0.005; ***p < 0.0005. Error bars indicate SEM.
Figure 12.
Figure 12.
PMA preincubation abolishes LIF-induced block of rod photoreceptor development. A–J, Immunofluorescence detection of rhodopsin (green) in WT P1 retinas after 4 d of culture in the presence of 100 nm PMA (B, G), 20 ng/ml of LIF (C, H), PMA and LIF added at the same time (D, I), and 6 h pretreatment with PMA followed by LIF (E, J). K, Graph of the number of rods present at the end of a 4 d culture of WT P1 retinas in the presence of PMA, LIF, and a combination. ***p < 0.005. Scale bar, 40 μm.

Similar articles

Cited by

References

    1. Altshuler D, Cepko C. A temporally regulated, diffusible activity is required for rod photoreceptor development in vitro. Development. 1992;114:947–957. - PubMed
    1. Altshuler D, Lo Turco JJ, Rush J, Cepko C. Taurine promotes the differentiation of a vertebrate retinal cell type in vitro. Development. 1993;119:1317–1328. - PubMed
    1. Ananthanarayanan B, Stahelin RV, Digman MA, Cho W. Activation mechanisms of conventional protein kinase C isoforms are determined by the ligand affinity and conformational flexibility of their C1 domains. J Biol Chem. 2003;278:46886–46894. - PubMed
    1. Asao H, Fu XY. Interferon-gamma has dual potentials in inhibiting or promoting cell proliferation. J Biol Chem. 2000;275:867–874. - PubMed
    1. Asotra K, Macklin WB. Developmental expression of protein kinase C isozymes in oligodendrocytes and their differential modulation by 4 beta-phorbol-12,13-dibutyrate. J Neurosci Res. 1994;39:273–289. - PubMed

Publication types

MeSH terms