. 2012 Apr;11(4):M111.011460.
doi: 10.1074/mcp.M111.011460. Epub 2011 Dec 14.

Antibody colocalization microarray: a scalable technology for multiplex protein analysis in complex samples

Affiliations

Antibody colocalization microarray: a scalable technology for multiplex protein analysis in complex samples

M Pla-Roca et al. Mol Cell Proteomics. 2012 Apr.

Abstract

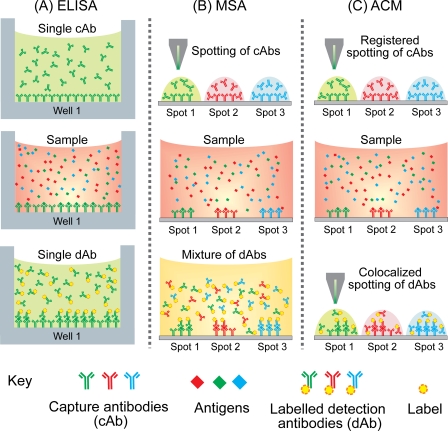
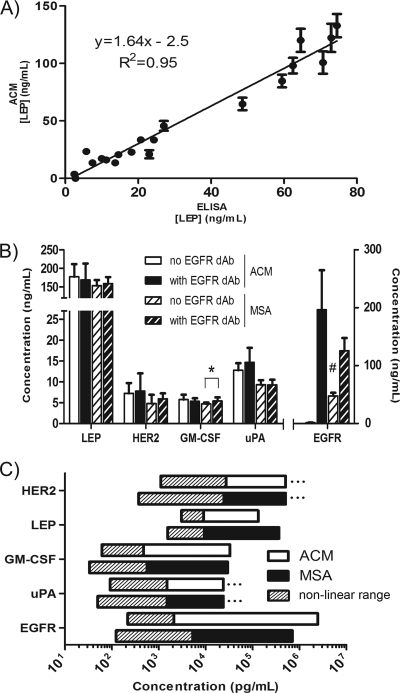
DNA microarrays were rapidly scaled up from 256 to 6.5 million targets, and although antibody microarrays were proposed earlier, sensitive multiplex sandwich assays have only been scaled up to a few tens of targets. Cross-reactivity, arising because detection antibodies are mixed, is a known weakness of multiplex sandwich assays that is mitigated by lengthy optimization. Here, we introduce (1) vulnerability as a metric for assays. The vulnerability of multiplex sandwich assays to cross-reactivity increases quadratically with the number of targets, and together with experimental results, substantiates that scaling up of multiplex sandwich assays is unfeasible. We propose (2) a novel concept for multiplexing without mixing named antibody colocalization microarray (ACM). In ACMs, both capture and detection antibodies are physically colocalized by spotting to the same two-dimensional coordinate. Following spotting of the capture antibodies, the chip is removed from the arrayer, incubated with the sample, placed back onto the arrayer and then spotted with the detection antibodies. ACMs with up to 50 targets were produced, along with a binding curve for each protein. The ACM was validated by comparing it to ELISA and to a small-scale, conventional multiplex sandwich assay (MSA). Using ACMs, proteins in the serum of breast cancer patients and healthy controls were quantified, and six candidate biomarkers identified. Our results indicate that ACMs are sensitive, robust, and scalable.


Figures

Fig. 1.
Fig. 1.
Schematic process flow for three sandwich assay formats, namely the ELISA (a singleplex assay), multiplexed sandwich assays (MSA) in microarray format, and the antibody colocalization microarray (ACM). A, In the ELISA, a single well is coated with a cAb, incubated with a sample, and following rinsing, a single, matched dAb incubated for detection. The dual binding of two Abs to a single analyte confers tolerance to cross-reactivity and nonspecific binding. B, In an MSA, cAbs are arrayed on a slide, which is incubated with a sample, and after rinsing, with a mixture of dAbs. C, In an ACM, the initial steps are identical to a MSA, with the difference that the first spotting is precisely registered and that a second round of spotting is used to deliver each dAb exactly on the spots with the matched cAb, physically colocalizing them. This protocol avoids mixing of reagents, and ACM may be seen as an array of singleplex nano-sandwich assays, each requiring only ∼ 1 nL of dAb solution.
Fig. 2.
Fig. 2.
Analysis of the number of liability pairs and of the vulnerability of MSAs to cross-reactivity. A, The ideal assay result (in the absence of cross-reactivity) shows protein 1 (orange) sandwiched between cAb 1 and dAb 1 on spot 1, and protein 2 (blue) sandwiched between cAb 2 and dAb 2 on spot 2; protein 1 is abundant and saturates the spots, whereas protein 2 is scarce. B, Five scenarios of cross-reactivity (i-v) on spot 2 occurring as a result of the cross-reaction among a pair of non-matched Abs and analytes. A false positive signal is detected when the non-matched dAb 1 cross-reacts with protein 2 (i), cAb 2 (ii), and dAb 2 (iii). Cross-reactive binding of protein 1 to respectively cAb 2 (iv) or protein 2 (v) will result in the binding of dAb1 to spot 2 and a false positive signal. The formulas in the boxes are the number of liability interactions that occur for an array with (N) targets calculated by combinatorial analysis (see SI for explanations). C, The total number of liability pairs increases quadratically with the number of analytes N as 4N(N-1).
Fig. 3.
Fig. 3.
Normalized cross-reactivity maps for a MSA with 14 Ab pairs. A, Fluorescence signals obtained in a negative control experiment without application of analyte followed by 14 experiments with a single dAb applied to a microarray. EGFR and uPAR dAb (rows) and CEA and LEP cAb (columns) all show significant cross-reactivity. CEA and LEP are the two Ab pairs with the weakest binding signal to their analyte at the concentration of 32 ng/ml used here making these assays vulnerable to cross-reactivity. B, Binding signals obtained by incubation of all arrays with a mixture of analytes followed by a single dAb each. Four columns for LEP, CEA HER2 and IL-6 are apparent, as well as rows for EGFR and to a lesser extend for uPA, suggesting that the respective cAb and the dAb are the source of cross-reactivity. For other events, it is difficult to ascribe the source. C, Signals observed upon incubating each array with a single antigen followed by a mixture of dAbs. Cross-reactivity signals are widespread indicating that mixing of dAbs is the primary source of cross-reactivity. D, Comparison of the maximal cross-reactivity signal for each cAb in (A-C) for the three different experiments. On aggregate, the cross-reactivity signal adds up to more than 50% of the binding signal for three analytes, >20% for eight, >10% for eleven, and >5% for all fourteen. These results indicate that cross-reactivity originates from multiple sources and will affect the accuracy for each target in this 14-plex MSA.
Fig. 4.
Fig. 4.
ACM layout and binding curves for 50 Ab pairs including all 14 proteins and Abs analyzed as part of a MSA shown in Fig. 3. A, Fluorescent micrograph of a representative slide with 16 replicate arrays incubated with two serum samples and corresponding dilutions (left), and buffer solution with recombinant proteins with seven dilutions and a negative control used to establish the standard curves (right). B, Detail of a single array with six replicate spots for each analyte forming a line. Standard binding curves of Ab pairs with lower (C) and higher (D) sensitivity that extend into the low pg/ml range (for CRP the concentration is in ng/ml). Lines are guide to the eye. Scale bar in (B): 2 mm.
Fig. 5.
Fig. 5.
Comparison of ACM with ELISA and MSA. A, Graphic showing the concentration of LEP measured in 20 serum samples from healthy donors with an ACM and a commercial ELISA kit. Error bars denote the variation of six replicate spots of the ACM. An excellent correlation (R2 = 0.95) is obtained between the two methods. B, Concentration of HER2, LEP, GMCSF, uPA, and EGFR measured using a 4-plex and a 5-plex (without and with EGFR dAb, respectively) antibody microarray in both MSA format and ACM format. The results obtained with ACM and MSA are similar. The addition of EGFR dAb to the assay leads to a significant increase (* p < 0.05) for the concentration of GM-CSF for the MSA assay, consistent with the cross-reactivity map reported in Fig. 3A; no significant changes were measured for the ACM. Please note (#) the high signal for EGFR in the 4-plex MSA without EGFR dAb that is indicative of cross-reaction toward the EGFR protein and/or cAb, and which presumably skews the result obtained in the 5-plex assay with EGFR dAb. C, The linear range of ACM (open bars) and MSA (closed bars) assays and LODs (left most point of hatched bar). Three dots indicate that the last experimental data point was within the linear range. Both assay formats are consistent and their linear range is between one to four orders of magnitude depending on the analyte.
Fig. 6.
Fig. 6.
Proteins differentially expressed in the serum of breast cancer patients and of healthy controls. (A–F) Logarithmic box plots of the concentration in pg/ml of six proteins in 11 controls (left box plot) and 15 breast cancer patients (right box plot). The boxes indicate the upper and lower quartile; the line is the median value and the whiskers show the range. The p value according to the Wilcoxon rank sum test is shown above the plot. OPN has the strongest discriminatory power with a p value of 8.09 × 10⁻⁵. (G–I) ROC curves corresponding to graphs (D–F), yielding AUC values of 0.97 for OPN, 0.81 for ENG and. 0.75 for IL-1B. (J) Hierarchical cluster analysis based on the six proteins. To allow comparison between different analytes with each different average concentrations and range, the concentration was converted to a log scale and mean transformed. The resulting color coding and Z scores are shown in the top left corner. White squares constitute data that were variable and were not used for clustering calculation. Estrogen receptor positive (ER+) breast cancer patients (highlighted in blue on the left) clustered at the top and healthy controls at the bottom. These results suggest that these six proteins might serve as biomarkers for diagnosis or prognosis of breast cancer.

References

    1. Moore G. E. (2003) No exponential is forever: but “Forever” can be delayed! Proceedings of the IEEE Solid-State Circuits Conference (ISSCC), pp. 20–23 vol. 21
    1. Pease A. C., Solas D., Sullivan E. J., Cronin M. T., Holmes C. P., Fodor S. P. (1994) Light-generated oligonucleotide arrays for rapid DNA sequence analysis. Proc. Natl. Acad. Sci. U. S. A. 91, 5022–5026 - PMC - PubMed
    1. Ragoussis J., Elvidge G. (2006) Affymetrix GeneChip® system: moving from research to the clinic. Exp. Rev. Mol. Diagnostics 6, 145–152 - PubMed
    1. Eisen M. B., Spellman P. T., Brown P. O., Botstein D. (1998) Cluster analysis and display of genome-wide expression patterns. Proc. Natl. Acad. Sci. U. S. A. 95, 14863–14868 - PMC - PubMed
    1. van de Vijver M. J., He Y. D., van't Veer L. J., Dai H., Hart A. A., Voskuil D. W., Schreiber G. J., Peterse J. L., Roberts C., Marton M. J., Parrish M., Atsma D., Witteveen A., Glas A., Delahaye L., van der Velde T., Bartelink H., Rodenhuis S., Rutgers E. T., Friend S. H., Bernards R. (2002) A gene-expression signature as a predictor of survival in breast cancer. N. Engl. J. Med. 347, 1999–2009 - PubMed

Publication types