. 2011 Dec;134(Pt 12):3602-15.
doi: 10.1093/brain/awr278.

Tracking iron in multiple sclerosis: a combined imaging and histopathological study at 7 Tesla

Affiliations

Tracking iron in multiple sclerosis: a combined imaging and histopathological study at 7 Tesla

Francesca Bagnato et al. Brain. 2011 Dec.

Abstract

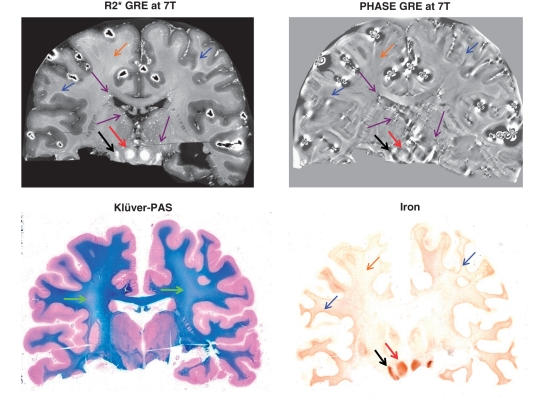
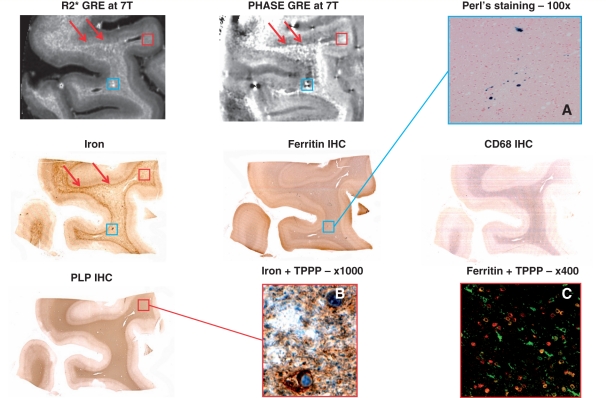
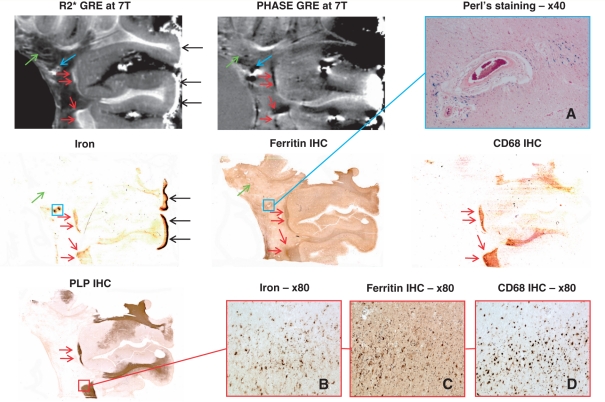
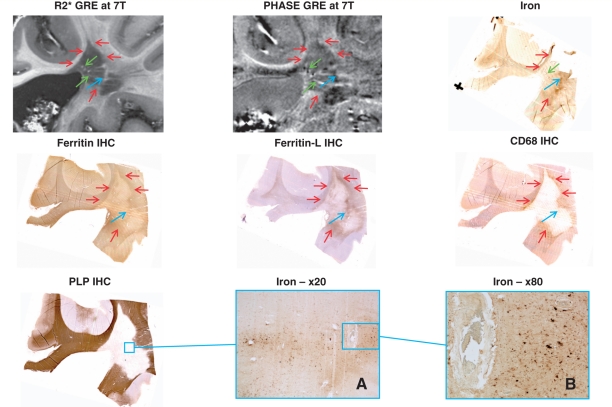
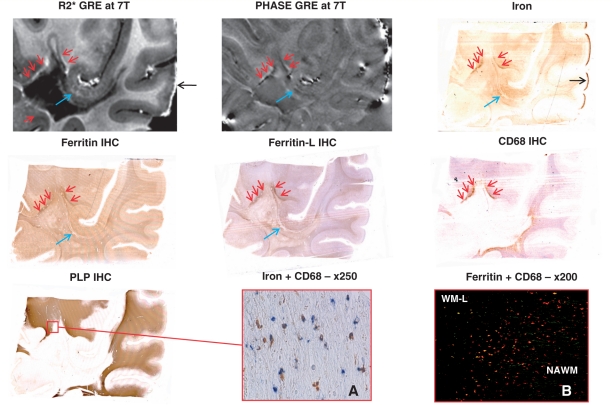
Previous authors have shown that the transverse relaxivity R(2)* and frequency shifts that characterize gradient echo signal decay in magnetic resonance imaging are closely associated with the distribution of iron and myelin in the brain's white matter. In multiple sclerosis, iron accumulation in brain tissue may reflect a multiplicity of pathological processes. Hence, iron may have the unique potential to serve as an in vivo magnetic resonance imaging tracer of disease pathology. To investigate the ability of iron in tracking multiple sclerosis-induced pathology by magnetic resonance imaging, we performed qualitative histopathological analysis of white matter lesions and normal-appearing white matter regions with variable appearance on gradient echo magnetic resonance imaging at 7 Tesla. The samples used for this study derive from two patients with multiple sclerosis and one non-multiple sclerosis donor. Magnetic resonance images were acquired using a whole body 7 Tesla magnetic resonance imaging scanner equipped with a 24-channel receive-only array designed for tissue imaging. A 3D multi-gradient echo sequence was obtained and quantitative R(2)* and phase maps were reconstructed. Immunohistochemical stainings for myelin and oligodendrocytes, microglia and macrophages, ferritin and ferritin light polypeptide were performed on 3- to 5-µm thick paraffin sections. Iron was detected with Perl's staining and 3,3'-diaminobenzidine-tetrahydrochloride enhanced Turnbull blue staining. In multiple sclerosis tissue, iron presence invariably matched with an increase in R(2)*. Conversely, R(2)* increase was not always associated with the presence of iron on histochemical staining. We interpret this finding as the effect of embedding, sectioning and staining procedures. These processes likely affected the histopathological analysis results but not the magnetic resonance imaging that was obtained before tissue manipulations. Several cellular sources of iron were identified. These sources included oligodendrocytes in normal-appearing white matter and activated macrophages/microglia at the edges of white matter lesions. Additionally, in white matter lesions, iron precipitation in aggregates typical of microbleeds was shown by the Perl's staining. Our combined imaging and pathological study shows that multi-gradient echo magnetic resonance imaging is a sensitive technique for the identification of iron in the brain tissue of patients with multiple sclerosis. However, magnetic resonance imaging-identified iron does not necessarily reflect pathology and may also be seen in apparently normal tissue. Iron identification by multi-gradient echo magnetic resonance imaging in diseased tissues can shed light on the pathological processes when coupled with topographical information and patient disease history.


Figures

Figure 1
Figure 1
Non-multiple sclerosis donor brain. Coronal sections of the 19-year-old male non-multiple sclerosis Case 1. Green arrows in the Klüver-PAS staining (bottom left) point to areas of myelin pallor in the centrum semiovale. This pallor is likely due to brain oedema possibly related to the cause of death. In the MRI map and iron staining (top and bottom right): black arrows indicate the substantia nigra and red arrows indicate the red nucleus, both rich in iron. In the same maps, blue arrows highlight the white matter–cortical grey matter junction, which is accentuated by relatively elevated iron; brown arrows indicate deep white matter with its low–moderate iron content. In the MRI maps only (top), purple arrows indicate vessel-like structures, particularly seen in the regions of the deep draining veins of the brain. GRE = gradient echo.
Figure 2
Figure 2
Normal-appearing white matter of Patient MS-2 with secondary progressing multiple sclerosis. Sections through a sample of temporal lobe of Patient MS-2 devoid of white matter lesions. In the MRI maps and iron staining (top left, top centre and middle left), red arrows indicate the white matter–cortical grey matter junction, whose signal is accentuated by relatively high iron content. In the same maps and in the ferritin immunohistochemistry staining (centre), blue boxes highlight a focus of iron accumulation. The respective area is shown at higher magnification of a slide stained with the Perl‘s method (A), which reveals haemosiderin deposition strongly suggestive of microhaemorrhage in this area. Red boxes in the MRI maps, proteolipid protein (PLP, bottom left) and iron stainings define the location where the double stainings (B and C) were photographed. (B) Double staining of iron (brown) and TPPP/p25 (blue). (C) Confocal microscopy double-staining of ferritin (green) and TPPP/p25 (red). Co-localization is rendered in yellow. GRE = gradient echo; IHC = immunohistochemistry.
Figure 3
Figure 3
Slowly expanding WML-1 and normal-appearing white matter of Patient MS-1 with secondary progressing multiple sclerosis. Sections through a sample from Patient MS-1 with a periventricular white matter lesion. Red arrows in the MRI maps (top centre and left), iron, ferritin, CD68 and proteolipid protein (PLP) stainings (middle left, centre, middle right and bottom left, respectively) indicate the lesional edges showing low–moderate demyelinating activity. Red box in the proteolipid protein staining defines the area where images B–D depict such an edge at higher magnification. Blue arrows in the MRI maps and blue boxes in the iron and ferritin stainings indicate a large vessel with thickened media and perivascular iron accumulation. (A) Perl's staining of this vessel reveals haemosiderin deposition. Green arrows in the MRI maps and in the iron and ferritin stainings point towards streaks and small rings of high R2* and variable phase, which matched with vessels found by histology. Black arrows indicate high amounts of iron located subpially, which are very likely an artefact due to long formalin fixation. GRE = gradient echo; IHC = immunohistochemistry.
Figure 4
Figure 4
Slowly expanding WML-2 and normal-appearing white matter of Patient MS-1 with secondary progressing multiple sclerosis. Sections through a sample from Patient MS-1 adjacent to the lateral ventricle showing a periventricular white matter lesion. This confluent lesion presented with virtually absent demyelinating activity at the edge, indicated by the red arrows in MRI maps (top centre and left) and all stainings [but proteolipid protein (PLP)]. Blue arrows and boxes highlight area of low demyelinating activity and perivascular iron accumulation around a vessel with thickened media, which is depicted at higher magnification by A and B. Green arrows in MRI maps and iron staining point towards streaks and small rings of high R2* and variable phase which matched with vessels found by histology. GRE = gradient echo; IHC = immunohistochemistry.
Figure 5
Figure 5
Slowly expanding WML-3 and normal appearing matter of Patient MS-1 with secondary progressing multiple sclerosis. Sections through a piece of temporal lobe from Patient MS-1 showing a white matter lesion. Red arrows in MRI maps (top centre and left) and all stainings [but proteolipid protein (PLP)] indicate lesion edges showing low–moderate demyelinating activity. Black arrows in the R2* image and iron staining point towards subpial iron accumulation, which is likely due to long formalin fixation. Red box in proteolipid protein staining defines the region where images A and B were taken. (A) Double staining of iron (brown) and CD68 (blue). (B) Confocal microscopy double staining of ferritin (green) and CD68 (red). Co-localization is rendered in yellow. Blue arrows point towards vessels with thickened media showing some iron accumulation located perivascularily. GRE = gradient echo; IHC = immunohistochemistry.

References

    1. Abduljalil AM, Schmalbrock P, Novak V. Chakeres distilled water. Enhanced gray and white matter contrast of phase susceptibility-weighted images in ultra-high-field magnetic resonance imaging. J Magn Reson Imaging. 2003;18:284–90. - PubMed
    1. Adams CW. Perivascular iron deposition and other vascular damage in multiple sclerosis. JNNP. 1988;51:260–5. - PMC - PubMed
    1. Bagnato F, Jeffries N, Richert ND, Stone RD, Ohayon JM, McFarland HF, et al. Evolution of T1 black holes in patients with multiple sclerosis imaged monthly for 4 years. Brain. 2003;126:1782–9. - PubMed
    1. Bagnato F, Yao B, Cantor F, Merkle H, Condon E, Montequin M, et al. Multisequence-imaging protocols to detect cortical lesions of patients with multiple sclerosis: observations from a post-mortem 3 Tesla imaging study. J Neurol Sci. 2009;282:80–5. - PMC - PubMed
    1. Bizzi A, Brooks RA, Brunetti A, Hill JM, Miletich RS, Francavilla TL, et al. Role of iron and ferritin in MR imaging of the brain: a study in primates at different field strengths. Radiology. 1990;177:59–65. - PubMed

Publication types

MeSH terms