. 2011 Dec 13;20(6):755-67.
doi: 10.1016/j.ccr.2011.10.019.

Oncogene-targeting T cells reject large tumors while oncogene inactivation selects escape variants in mouse models of cancer

Affiliations

Oncogene-targeting T cells reject large tumors while oncogene inactivation selects escape variants in mouse models of cancer

Kathleen Anders et al. Cancer Cell. .

Abstract

The genetic instability of cancer cells frequently causes drug resistance. We established mouse cancer models, which allowed targeting of an oncogene by drug-mediated inactivation or monospecific CD8(+) effector T (T(E)) cells. Drug treatment of genetically unstable large tumors was effective but selected resistant clones in the long term. In contrast, T(E) cells completely rejected large tumors (≥500 mm(3)), if the target antigen was cancer-driving and expressed in sufficient amounts. Although drug-mediated oncogene inactivation selectively killed the cancer cells and left the tumor vasculature intact, which likely facilitated survival and growth of resistant clones, T(E) cell treatment led to blood vessel destruction and probably "bystander" elimination of escape variants, which did not require antigen cross-presentation by stromal cells.


Conflict of interest statement

The authors declare no competing financial interests.

Figures
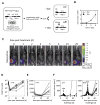
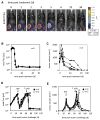
Figure 1
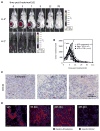
Figure 1. Drug-mediated oncogene inactivation in large tumors induces transient tumor regression
(A) Tet-TagLuc fibrosarcoma cells were generated by infection of primary fibroblasts of a TREloxPstoploxPTagLuc transgenic mouse with a Cre-encoding adenovirus (AdCre) to excise the stop cassette, a Tet-off transactivator-encoding retrovirus (RvtTA) and adaptation to in vivo growth at passage 19 (p19). Expression of the TagLuc fusion gene can be regulated by dox. (B) Tet-TagLuc cells (1×10⁴) in duplicates were cultured with (0.5 μg/ml) or without dox and cell numbers were determined daily for 4 days. Error bars represent ± SD. (C)Rag −/− mice with established Tet-TagLuc tumors (mean ± SD, 546 ± 246 mm3 at ~30 days) received dox-containing drinking water and TagLuc expression was followed by BL imaging (1 s exposure time). The time post treatment is indicated in days (d). (D) BL signals of dox-treated tumors of individual mice (n=8) were quantified over time. (E) Tumor growth kinetics is displayed for mice shown in (D). Results in (C-E) are representative for 3 experiments with a total of 12 analyzed mice. (F) Tumor growth kinetics of individual mice (n=7) with small Tet-TagLuc tumors (≤250 mm3) treated with dox are shown in the left panel. Time point of dox treatment is indicated. For comparison, the mice with large tumors as in E are shown (right panel). The number of mice with tumor relapse is indicated.
Figure 2
Figure 2. Each dox-unresponsive tumor reveals a unique point mutation in the transactivator gene
(A) Parental Tet-TagLuc cells and cells of three dox-unresponsive tumors were cultured for 5 days in the presence of dox (1 μg/ml) and TagLuc expression was analyzed by Western blot analysis with an anti-Tag antibody. As loading control, β-actin was detected. (B) Relative light units (RLU) were analyzed in parental and drug-resistant Tet-TagLuc cells, cultured in the presence or absence of dox. One out of 3 analyzed dox-unresponsive tumors with similar results is shown. Error bars represent ± SD. (C) Comparison of the tTA amino acid (AA) sequence from position 64 to182 of parental Tet-TagLuc cells (top) and 7 dox-unresponsive tumors (tumor 2 and 6 with 2 mutations). Mutations are shown in bold. Mutations in the tTA leading to dox-unresponsive variants are indicated by a black circle.
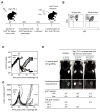
Figure 3
Figure 3. Partial compensation of selection of dox-unresponsive tumors by endogenous T cells
(A) Scheme of the experimental design. The mice, which rejected the tumor, received two albino B6 skin grafts expressing either the Luc or the rtTA transgene, both shared with the tumor cells. (B) Expansion of transferred CD8+ T cells was determined 5 and 19 days after dox treatment by determining the percentage of transferred (Vβ5) out of total CD8+ T cells (4.41 ± 1.64 vs. 9.56 ±1.9; n=3). (C) BL signals of tumors (892 ± 237 mm3) were determined over time. (◆) Spleen cell transfer and dox-treatment (n=12); (○) spleen cell transfer without dox-treatment (n=3). (◇) dox-treatment but no spleen cell transfer (n=2). (D) Tumor growth kinetics of mice shown in (C). Number of mice with rejected or relapsed tumors are indicated. (E) Photographs (upper panel) and pictures of BL measurement (middle panel) of Luc+ (right) and rtTA+ skin grafts (left) transplanted on either C57Bl/6 mice (left), Rag−/−/OT-1 mice reconstituted with Tag-tolerant splenocytes that did not (middle) or did receive and reject a tumor after dox treatment (right). Pictures were acquired more than 3 month after skin transplantation. One representative example of each group is shown. Number of graft rejection/number of mice in experiment and time of graft rejection in days (d) is given.
Figure 4
Figure 4. Complete eradication of large genetically unstable tumors by adoptive T cell therapy with single peptide specific TE cells
(A) Rag−/− mice with established Tet-TagLuc tumors (837 ± 287 mm3) received 1×10⁶ TCR-I TE cells and changes of TagLuc signal was followed by BL imaging (1 s exposure time). The time post treatment is indicated in days (d). See also Figure S1. (B) BL signals of TE cell-treated tumors of individual mice (n=5) were measured over time. (C) Tumor growth kinetics of mice shown in (B). Results in (A–C) are representative for 3 experiments with a total of 10 analyzed mice. (D) Rag−/− mice with established Tet-TagLuc tumors (643 ± 82 mm3) were treated with dox and relapsed tumors (6/6) were subsequently treated by TE cells (●; n=4) or were left untreated (○; n=2). Changes in BL signal over time of individual mice are shown. (E) Tumor growth kinetics of mice shown in (D). One representative out of 2 experiments with a total of 8 double-treated mice is shown.
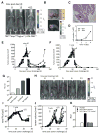
Figure 5
Figure 5. Drug but not TE cell resistance of gastric carcinoma and dependence of T cell therapy on TagLuc expression level
(A) Sporadic tumor development was monitored in a TREloxPstoploxPTagLuc+/−/rtTA-CM2+/− double transgenic mouse by BL imaging. Time after starting dox administration in days (d) is indicated. (B) A tumor, located on the outer wall of the stomach fundus, was isolated from the mouse shown in (A). A photograph (upper panel) and a BL image (lower panel) were acquired ex vivo. (C) A section of the isolated stomach tumor was stained with anti-Tag antibodies (scale bar 100 μm). (D) Proliferation of 1×10⁴ cells (TC200.09) from the stomach tumor was analyzed in the presence and absence of dox in duplicates for 4 days. Standard deviation (SD) is indicated. (E) Rag−/− mice with established TC200.09 tumors (453 ± 110 mm3 at day 49) were left untreated (○; n=1) or treated by dox withdrawal (●; n=9) and tumor growth kinetics was determined. (F) Rag−/− mice with established TC200.09 tumors (435 ± 100 mm3 at day 49) were left untreated (○; n=1) or were treated with TE cells (●; n=10) and tumor growth kinetics was determined. Arrows in (E and F) indicate time point of treatment. (G) TagLuc expression in MCA-TagLuc, TC200.09 and Tet-TagLuc tumor cells was determined by quantifying relative light units (RLU) in 5×10⁵ cells (duplicates). Data represent mean values from three independent experiments (±SD). (H) Rag−/− mice with small MCA-TagLuc tumors (166 ± 55 mm3 ten days after cell injection) received TE cells as before and loss of TagLuc signal was followed by BL imaging. (I) BL signals of TE cell-treated (●; n=8) or untreated MCA-TagLuc tumors (○; n=2) in individual mice were measured over time. Error bars in (D), (G) and (K) represent ± SD. (J) Tumor growth kinetics of mice shown in (I) shows outgrowth of escape variants. Number of mice with tumor rejection per total number of mice is indicated. One representative out of 2 experiments is shown. (K) RLU were analyzed in MCA205, parental MCA-TagLuc cells and two tumors that escaped TE cell treatment.
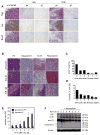
Figure 6
Figure 6. TE cells kill by apoptosis induction, while TagLuc inactivation induces autophagy
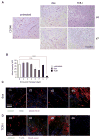
(A) Consecutive Tet-TagLuc tumor sections were stained with antibodies against Tag, luciferase and Ki-67 at the indicated days (d) after therapy. See also Figure S2. (B) Consecutive sections of untreated (n=3), dox treated (day 1 post therapy; n=3) or TE cell treated tumors (day 4 post therapy; n=3) were stained with HE and antibodies against cleaved Caspase 3 (cleaved-C3), Ki-67 and fibronectin (scale bar in (A) and (B) 100 μm). (C) Quantification of Ki-67+ cells at different time points after TagLuc inactivation. (D) Quantification of cleaved-C3+ cells at different time points after TagLuc inactivation. A total of 1000 cells in 5 non-overlapping high-power fields were counted in (C) and (D) for each time point. Three tumors per time point were analyzed. For day seven two tumors were analyzed. (E) Tet-TagLuc cells were treated in vitro with dox or were left untreated. After the indicated time points, cells were stained with Annexin V and propidium iodide (PI). Mean values from two experiments are shown (±SD). (F) Tet-TagLuc cells were cultured in the absence or presence of dox as indicated and indicated proteins were analyzed by immunoblotting. Equal protein loading was confirmed by β-actin detection. See also Figure S 2. Error bars in (C) – (E) represent ± SD.
Figure 7
Figure 7. TE cell treatment but not TagLuc inactivation leads to destruction of the tumor vasculature
(A) Tet-TagLuc tumor sections were stained for the endothelial cell marker CD146 at the indicated days (d) after start of therapy (scale bar 100 μm). See also Figure S3. (B) Quantification of blood vessels (CD146+) in sections of untreated (n=3), dox treated (d1 to d3, and d7 n=2; d4 n=3) and TE cell treated (d4 and d7; n=3) tumors (mean of 5 HPF at 400-fold magnification). Error bars represent ± SD. ***p 0.001; n.s. not significant (p 0.372); t-test with Bonferroni correction. (C) IVMPM of blood vessels (red), extracellular matrix (ECM; blue), and Annexin V+ cells (green) subsequent to dox administration for time points as indicated. (D) IVMPM of blood vessels (red), adoptively transferred CD8+ cells (blue), and Annexin V+ cells (green) subsequent to adoptive T cell transfer for time points as indicated. Scale bar 100 μm.
Figure 8
Figure 8. Antigen cross presentation is dispensable for rejection of large Tet-TagLuc tumors by TE cells
(A) SCID mice (H-2d) with established Tet-TagLuc tumors (521 ± 118 mm3 26 days after cell injection) were treated with H-2 Db restricted TE cells and changes of TagLuc signal was monitored by BL imaging (1 s exposure time). One representative example out of 12 analyzed mice is shown. For comparison, BL signal change in a tumor, growing in an identically treated Rag−/− mouse (H-2b), is shown. See also Figure S4. (B) Kinetics of tumor rejection in TE cell treated (n=12) or untreated SCID (n=1) and TE cell treated Rag−/− mice (n=1). (C) Tumors were isolated from untreated SCID mice (n=3) or 6 (n=2) and 12 days (n=1) after TE cell therapy and stained for the endothelial cell marker CD146. (D) Rag−/− mice with established J558L-IFN-γIND tumors (200 ± 40 mm3 at day 7; n=4) received 10 μg dox i.p. for local IFN-γ production. Integrity of the tumor vasculature was analyzed at indicated time points after dox treatment by IVMPM.

References

    1. Blankenstein T. The role of tumor stroma in the interaction between tumor and immune system. Curr Opin Immunol. 2005;17:180–186. - PubMed
    1. Blohm U, Potthoff D, van der Kogel AJ, Pircher H. Solid tumors “melt” from the inside after successful CD8 T cell attack. Eur J Immunol. 2006;36:468–477. - PubMed
    1. Briesemeister D, Sommermeyer D, Loddenkemper C, Loew R, Uckert W, Blankenstein T, Kammertoens T. Tumor rejection by local interferon-γ induction in established tumors is associated with blood vessel destruction and necrosis. Int J Cancer. 2010;128:371–378. - PubMed
    1. Buschow C, Charo J, Anders K, Loddenkemper C, Jukica A, Alsamah W, Perez C, Willimsky G, Blankenstein T. In vivo imaging of an inducible oncogenic tumor antigen visualizes tumor progression and predicts CTL tolerance. J Immunol. 2010;184:2930–2938. - PubMed
    1. Casares N, Pequignot MO, Tesniere A, Ghiringhelli F, Roux S, Chaput N, Schmitt E, Hamai A, Hervas-Stubbs S, Obeid M, et al. Caspase-dependent immunogenicity of doxorubicin-induced tumor cell death. J Exp Med. 2005;202:1691–1701. - PMC - PubMed

Publication types

MeSH terms