

Improving performance of computer-aided detection of masses by incorporating bilateral mammographic density asymmetry: an assessment
- PMID: 22173323
- PMCID: PMC3274572
- DOI: 10.1016/j.acra.2011.10.026
Improving performance of computer-aided detection of masses by incorporating bilateral mammographic density asymmetry: an assessment
Abstract
Rationale and objectives: Bilateral mammographic density asymmetry is a promising indicator in assessing risk of having or developing breast cancer. This study aims to assess the performance improvement of a computer-aided detection (CAD) scheme in detecting masses by incorporating bilateral mammographic density asymmetrical information.
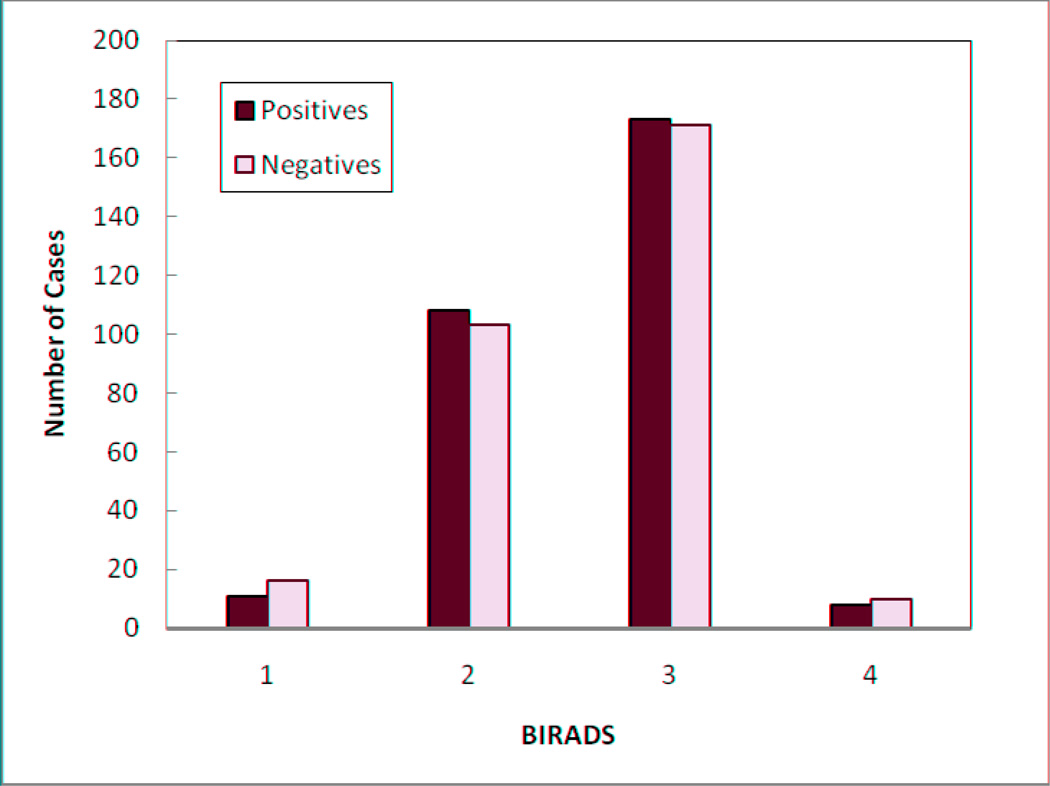
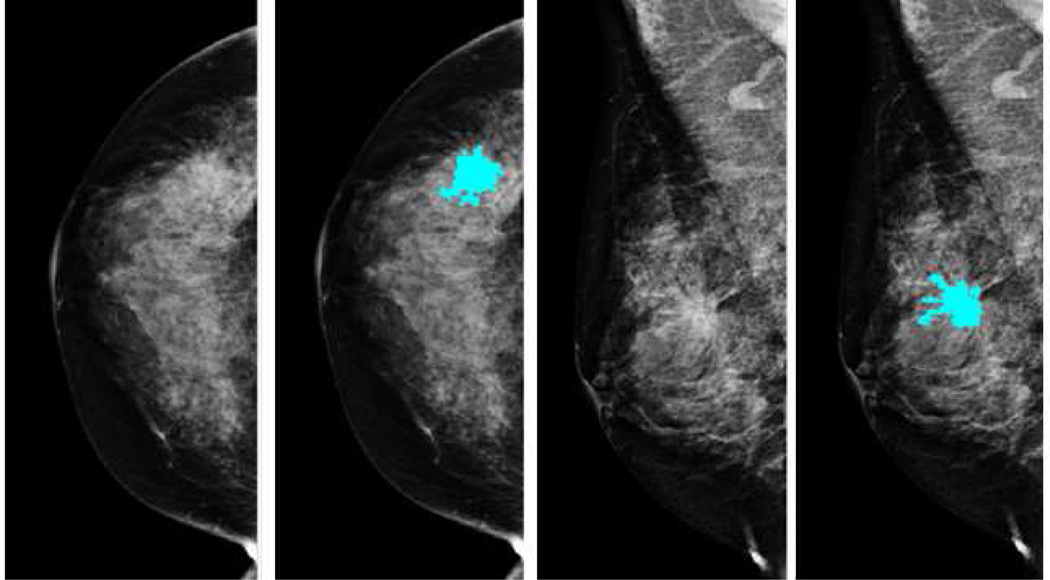
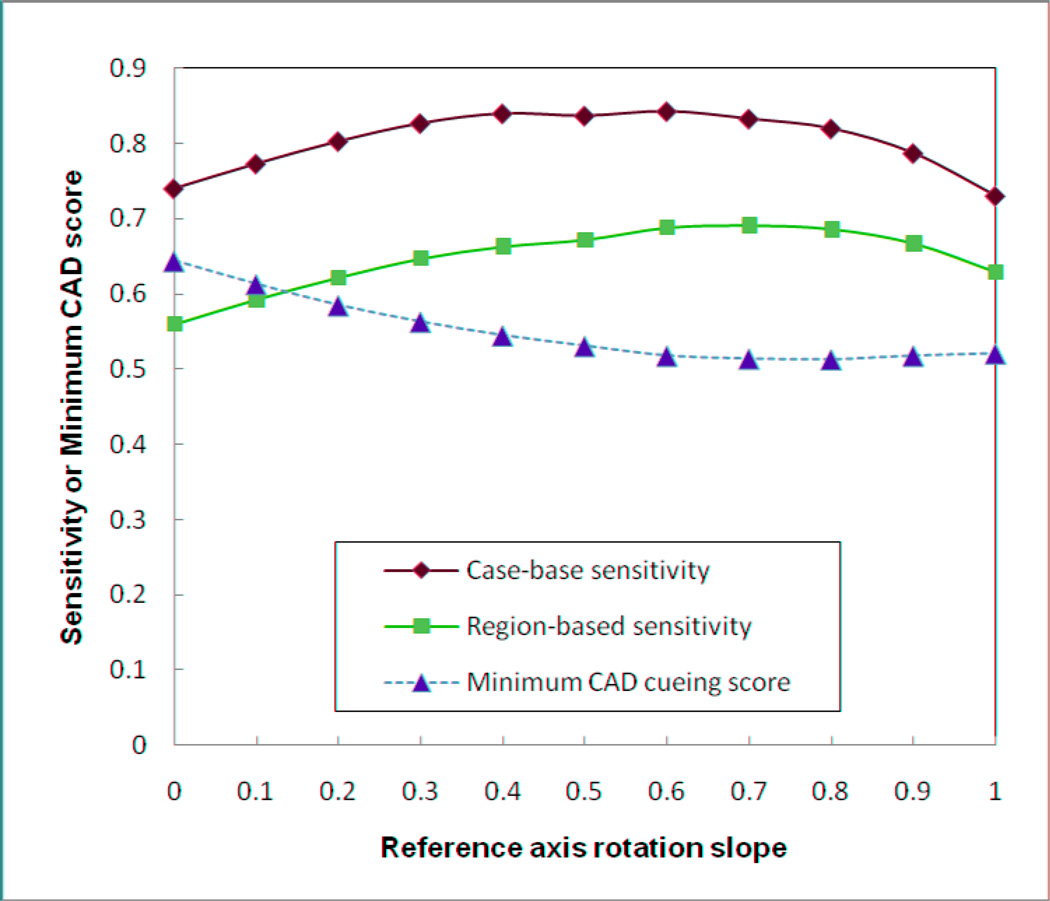
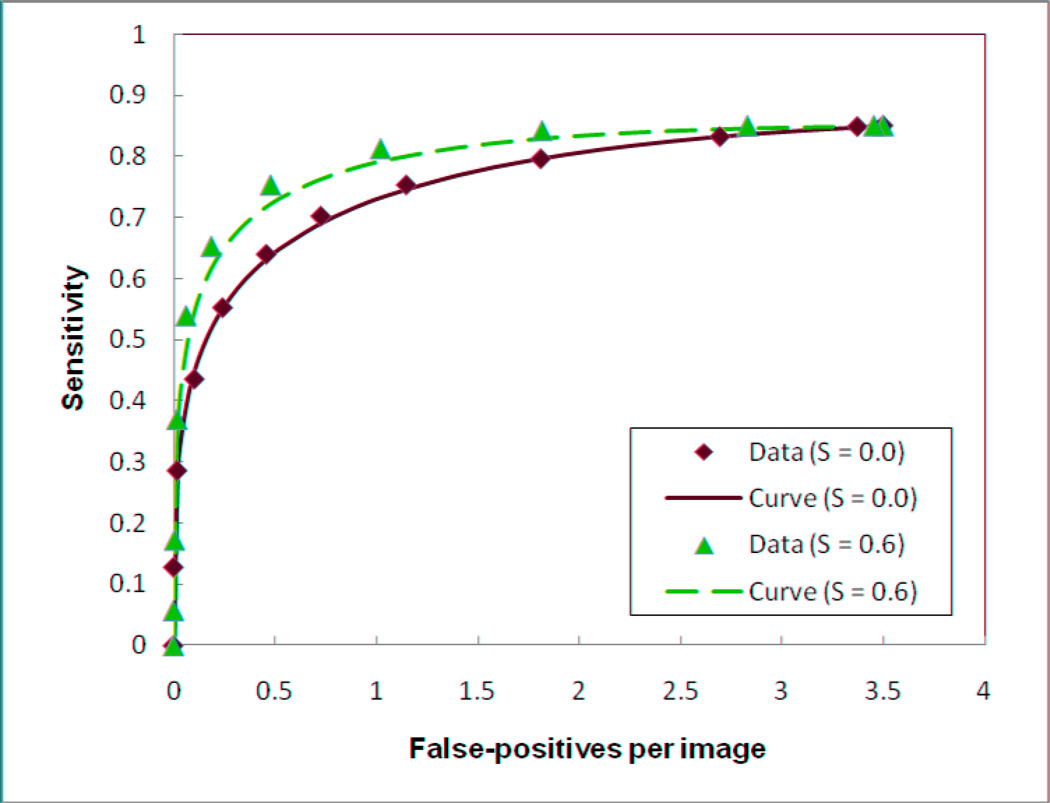
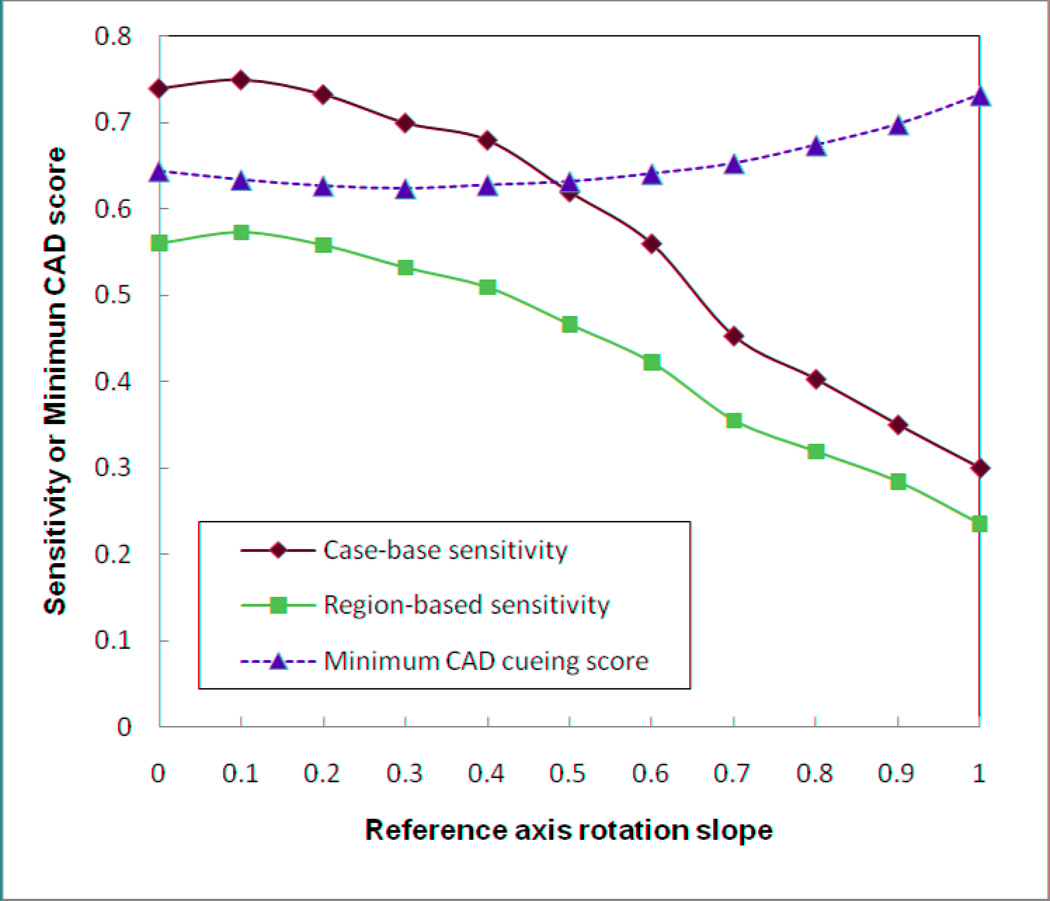
Materials and methods: A testing dataset containing 2400 full-field digital mammograms (FFDM) acquired from 600 examination cases was established. Among them, 300 were positive cases with verified cancer associated with malignant masses and 300 were negative cases. Two computerized schemes were applied to process images of each case. The first single-image based CAD scheme detected suspicious mass regions and the second scheme computed average and difference of mammographic tissue density depicted between the left and right breast. A fusion method based on rotation of the CAD scoring projection reference axis was then applied to combine CAD-generated mass detection scores and either the computed average or difference (asymmetry) of bilateral mammographic density scores. The CAD performance levels with and without incorporating mammographic density information were evaluated and compared using a free-response receiver operating characteristic type data analysis method.
Results: CAD achieved a case-based mass detection sensitivity of 0.74 and a region-based sensitivity of 0.56 at a false-positive rate of 0.25 per image. By fusing the CAD and bilateral mammographic density asymmetry scores, the case-based and region-based sensitivity levels of the CAD scheme were increased to 0.84 and 0.69, respectively, at the same false-positive rate. Fusion with average mammographic density only slightly increased CAD sensitivity to 0.75 (case-based) and 0.57 (region-based).
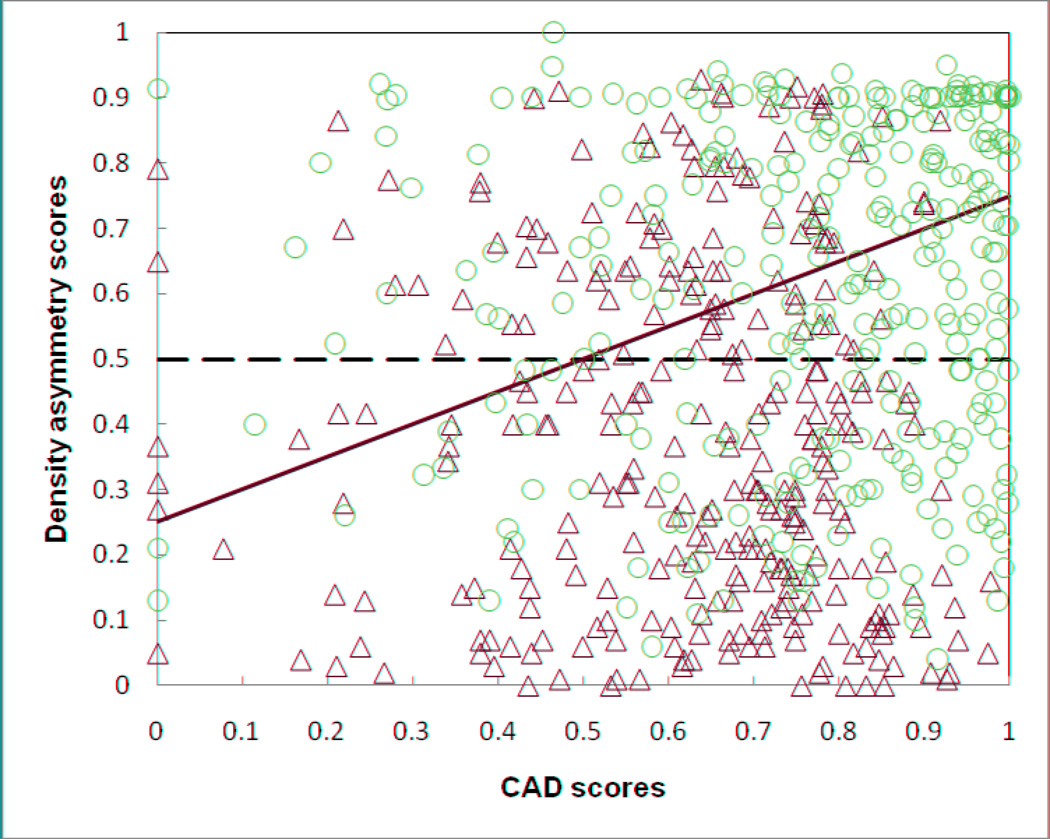
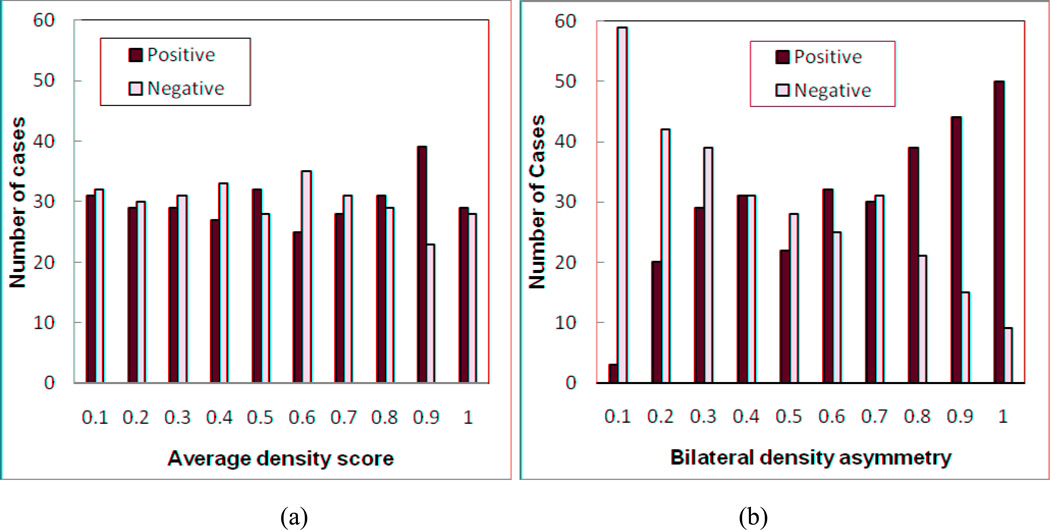
Conclusions: This study indicated that 1) bilateral mammographic density asymmetry was a stronger indicator of the case depicting suspicious masses than the average density computed from two breasts and 2) fusion between the conventional CAD scores and bilateral mammographic density asymmetry information could substantially increase CAD performance in mass detection.
Copyright © 2012 AUR. Published by Elsevier Inc. All rights reserved.
Figures

Similar articles
-
A method to test the reproducibility and to improve performance of computer-aided detection schemes for digitized mammograms.Med Phys. 2004 Nov;31(11):2964-72. doi: 10.1118/1.1806291. Med Phys. 2004. PMID: 15587648
-
Computerized detection of breast tissue asymmetry depicted on bilateral mammograms: a preliminary study of breast risk stratification.Acad Radiol. 2010 Oct;17(10):1234-41. doi: 10.1016/j.acra.2010.05.016. Acad Radiol. 2010. PMID: 20619697 Free PMC article.
-
Computer-aided detection; the effect of training databases on detection of subtle breast masses.Acad Radiol. 2010 Nov;17(11):1401-8. doi: 10.1016/j.acra.2010.06.009. Epub 2010 Jul 22. Acad Radiol. 2010. PMID: 20650667 Free PMC article.
-
Improving performance of computer-aided detection scheme by combining results from two machine learning classifiers.Acad Radiol. 2009 Mar;16(3):266-74. doi: 10.1016/j.acra.2008.08.012. Acad Radiol. 2009. PMID: 19201355 Free PMC article.
-
A review of automatic mass detection and segmentation in mammographic images.Med Image Anal. 2010 Apr;14(2):87-110. doi: 10.1016/j.media.2009.12.005. Epub 2009 Dec 29. Med Image Anal. 2010. PMID: 20071209 Review.
Cited by
-
Repeated measures of mammographic density and texture to evaluate prediction and risk of breast cancer: a systematic review of the methods used in the literature.Cancer Causes Control. 2023 Nov;34(11):939-948. doi: 10.1007/s10552-023-01739-2. Epub 2023 Jun 20. Cancer Causes Control. 2023. PMID: 37340148 Free PMC article.
-
Automated Assessment of Breast Positioning Quality in Screening Mammography.Cancers (Basel). 2022 Sep 27;14(19):4704. doi: 10.3390/cancers14194704. Cancers (Basel). 2022. PMID: 36230625 Free PMC article.
-
Left-right analysis of mammary gland development in retinoid X receptor-α+/- mice.Philos Trans R Soc Lond B Biol Sci. 2016 Dec 19;371(1710):20150416. doi: 10.1098/rstb.2015.0416. Philos Trans R Soc Lond B Biol Sci. 2016. PMID: 27821527 Free PMC article.
-
A modified undecimated discrete wavelet transform based approach to mammographic image denoising.J Digit Imaging. 2013 Aug;26(4):748-58. doi: 10.1007/s10278-012-9555-6. J Digit Imaging. 2013. PMID: 23207923 Free PMC article.
-
A clinical model for identifying the short-term risk of breast cancer.Breast Cancer Res. 2017 Mar 14;19(1):29. doi: 10.1186/s13058-017-0820-y. Breast Cancer Res. 2017. PMID: 28288659 Free PMC article.
References
-
- Jemal A, Siegel R, Xu J, Ward E. Cancer statistics 2010. CA Cancer J Clin. 2010;60:277–300. - PubMed
-
- Smith RA, Cokkindes V, Brooks D, et al. Cancer screening in the United States, 2011. CA Cancer J Clin. 2011;61:8–30. - PubMed
-
- Birdwell RL, Ikeda DM, O’Shaughnessy KD. Mammographic characteristics of 115 missed cancers later detected with screening mammography and the potential utility of computer-aided detection. Radiology. 2001;219:192–202. - PubMed
-
- Sickles EA, Wolverton DE, Dee KE. Performance parameters for screening and diagnostic mammography: specialist and general radiologists. Radiology. 2002;224:861–869. - PubMed
-
- Nishikawa RM. Current status and future directions of computer-aided diagnosis in mammography. Comput Med Imaging Graph. 2007;31:224–235. - PubMed
Publication types
MeSH terms
Grants and funding
LinkOut - more resources
Full Text Sources
Medical
Miscellaneous
