. 2011 Dec 27;108(52):21016-21.
doi: 10.1073/pnas.1107473108. Epub 2011 Dec 15.

Perforin activity at membranes leads to invaginations and vesicle formation

Affiliations

Perforin activity at membranes leads to invaginations and vesicle formation

Tilen Praper et al. Proc Natl Acad Sci U S A. .

Abstract

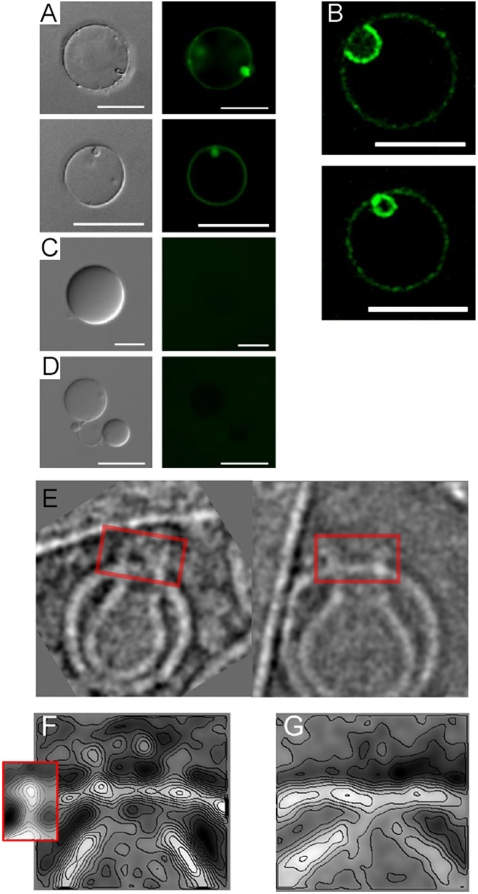
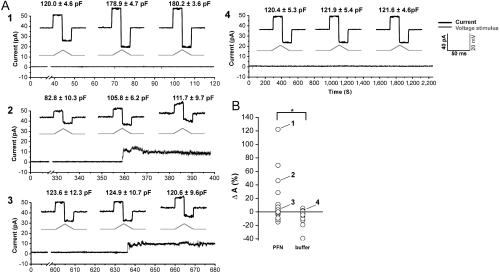
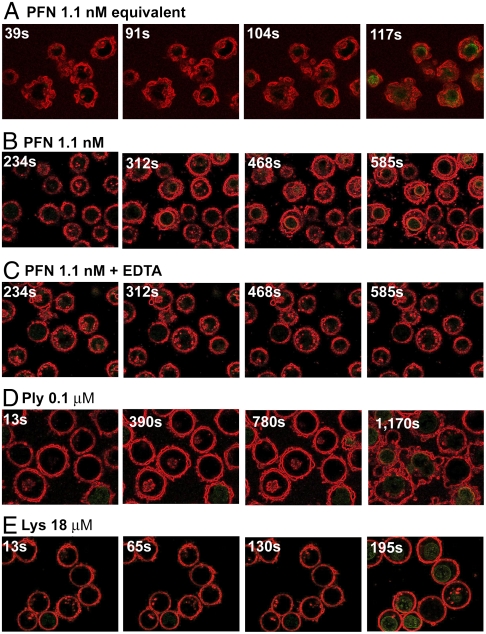
The cytotoxic cell granule secretory pathway is essential for immune defence. How the pore-forming protein perforin (PFN) facilitates the cytosolic delivery of granule-associated proteases (granzymes) remains enigmatic. Here we show that PFN is able to induce invaginations and formation of complete internal vesicles in giant unilamellar vesicles. Formation of internal vesicles depends on native PFN and calcium and antibody labeling shows the localization of PFN at the invaginations. This vesiculation is recapitulated in large unilamellar vesicles and in this case PFN oligomers can be seen associated with the necks of the invaginations. Capacitance measurements show PFN is able to increase a planar lipid membrane surface area in the absence of pore formation, in agreement with the ability to induce invaginations. Finally, addition of PFN to Jurkat cells causes the formation of internal vesicles prior to pore formation. PFN is capable of triggering an endocytosis-like event in addition to pore formation, suggesting a new paradigm for its role in delivering apoptosis-inducing granzymes into target cells.


Conflict of interest statement

The authors declare no conflict of interest.

Figures

Fig. 1.
Fig. 1.
Formation of invaginations and ILVs in GUVs by PFN. (A) Invaginations and secondary vesicle formation induced by 12 nM PFN in the presence of 0.1 mM Ca2+. The fluorescence derived from rDHPE is shown in red. (B) Time course of PFN-induced secondary vesicle formation. The formation of two invaginations on a single GUV may be seen, denoted by an arrow and an arrowhead. rDHPE fluorescence (red), D70 fluorescence (green), and a merged image is shown for the final image. The time (in seconds) after the mixing of all components is shown on each image. (C) Secondary vesicles are filled with external medium that contains fluorescent probes as indicated. For D4 also the primary GUV is full, because PFN pores formed on the membranes allow the passage of this small dextran across the membrane. (D) Three-dimensional reconstitution of GUVs with secondary vesicles. D70 was in the external medium. The indicated area is shown enlarged below. (EF) Experiments were performed in the presence of 70 kDa FITC-labeled dextran, 12 nM PFN, and the amount of GUVs with secondary vesicles was quantified after 45 min, except as indicated. In total four to eight independent experiments were performed for each condition with 104–211 GUVs analyzed. Different conditions were compared with a nonparametric Mann–Whitney test (*, p < 0.05; **, p < 0.01; n.s., not significant). (E) Experiment was performed in the presence of 5 mM EDTA or 0.25 mM CaCl2, as indicated. The buffer used for the purification of PFN was used as a control in the absence of PFN. Each data point represents an independent experiment, the median is shown by the black line. (F) PFN concentration dependence of ILV formation. Experiments that were performed in the presence of 6, 12, or 48 nM PFN are compared to the bovine serum albumin control (12 nM) and control where PFN (12 nM) was denatured with heat (dPFN). Quantification of ILVs was done for 12 nM PFN also after 10 min as indicated.
Fig. 2.
Fig. 2.
Detection of membrane-bound PFN by anti-PFN δG9-FITC labeled antibodies and cryo-EM. (A) Fluorescence microscopy of GUVs in the presence of 12 nM (Top) or 24 nM (Bottom) of PFN stained with anti-PFN δG9-FITC labeled antibodies. (B) Confocal microscopy that shows a cross section of two GUVs with enriched signal in the invagination (Top) and in the ILV (Bottom). The experiment was performed as in A, the concentration of PFN was 24 nM. (C) GUVs in the absence of PFN and in the presence of anti-PFN δG9-FITC labeled antibodies. (D) GUVs in the presence of 24 nM PFN and isotype antibodies control (IgG2b isotype; antiglycophorin-FITC labeled antibodies). Scale bar is 20 μm in A, B, and D, but 10 μm in C. The concentration of antibodies was approximately 30 μg/mL. Differential interference contrast images are shown for comparison (Left). (E) Images of LUV invaginations with PFN oligomers (boxed). (F) Representative class average contour plot derived from alignment and classification of images of the junctions between primary outer membranes and secondary internal compartments/invaginations in the presence of PFN. Inset shows the subunit structure of PFN in its oligomeric prepore state bound to the membrane surface (20). (G) The equivalent image to F derived in the absence of PFN.
Fig. 3.
Fig. 3.
PFN induces changes in membrane area in PLM. (A) Representative traces of electrical current for experiments 1–4 highlighted in B. The current response from which the capacitance was calculated is enlarged, the triangular wave form of voltage is shown below the enlarged response (gray). The calculated capacitance shown above the trace is the average of 10 measurements on the same time interval ± standard deviation. The scale for all enlargements is identical (40 pA, 50 ms, 20 mV). The current was measured at a constant voltage of +10 mV with the exception of intervals where the triangular wave form were applied (those intervals were removed from the main current trace for the clarity). (B) Changes in membrane area (ΔA) in the presence of PFN or buffer (39 or 41 measurements on freshly prepared membranes, respectively). We calculated ΔA from the membrane Cm as described in Materials and Methods.
Fig. 4.
Fig. 4.
Jurkat cells under permeabilization, Membranes have been stained red with CellMask PM Orange (Invitrogen) and the green dye is SYTOX Green (Invitrogen). The time in seconds at which each image was taken is given at the top left in each case. These images have been edged-enhanced using ImageJ (http://imagej.nih.gov/ij/index.html) software; the full movies of unenhanced and enhanced data are presented as Movies S1, S2, S3, S4, S5, S6, S7, S8, S9, and S10. (A) Final concentration of PFN is 1.1 nM; (B) 1.1 nM final concentration, a positive control for C; (C) 1.1 nM in the presence of 2 mM EDTA. (D) Pneumolysin concentration is 0.1 μM; (E) 18 μM lysenin.

References

    1. Bolitho P, Voskoboinik I, Trapani JA, Smyth MJ. Apoptosis induced by the lymphocyte effector molecule perforin. Curr Opin Immunol. 2007;19:339–347. - PubMed
    1. Pipkin ME, Lieberman J. Delivering the kiss of death: Progress on understanding how perforin works. Curr Opin Immunol. 2007;19:301–308. - PMC - PubMed
    1. Voskoboinik I, Smyth MJ, Trapani JA. Perforin-mediated target-cell death and immune homeostasis. Nat Rev Immunol. 2006;6:940–952. - PubMed
    1. Metkar SS, et al. Cytotoxic cell granule-mediated apoptosis: Perforin delivers granzyme B-serglycin complexes into target cells without plasma membrane pore formation. Immunity. 2002;16:417–428. - PubMed
    1. Podack ER, Dennert G. Assembly of two types of tubules with putative cytolytic function by cloned natural killer cells. Nature. 1983;302:442–445. - PubMed

Publication types

LinkOut - more resources