. 2012 Apr;9(2):422-45.
doi: 10.1007/s13311-011-0090-9.

Effects of Olig2-overexpressing neural stem cells and myelin basic protein-activated T cells on recovery from spinal cord injury

Affiliations

Effects of Olig2-overexpressing neural stem cells and myelin basic protein-activated T cells on recovery from spinal cord injury

Jian-Guo Hu et al. Neurotherapeutics. 2012 Apr.

Abstract

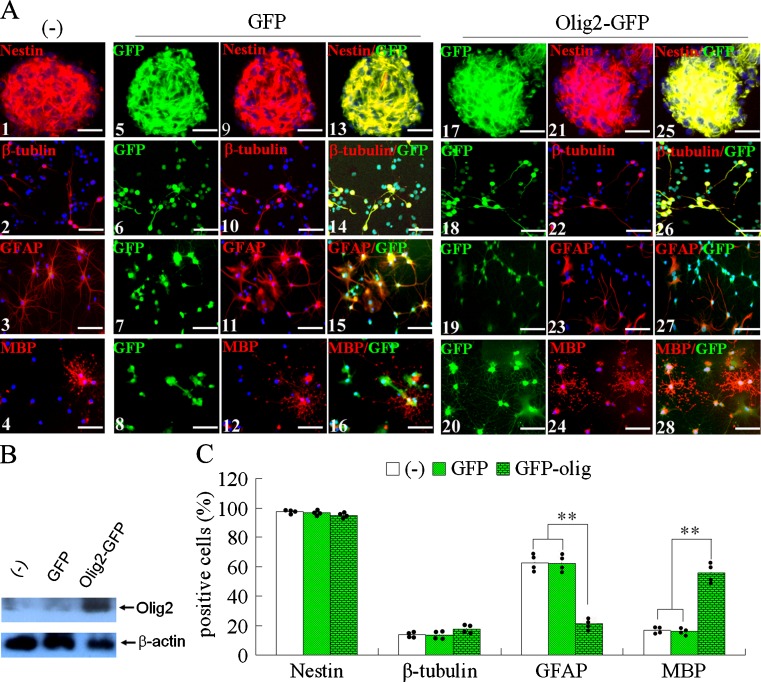
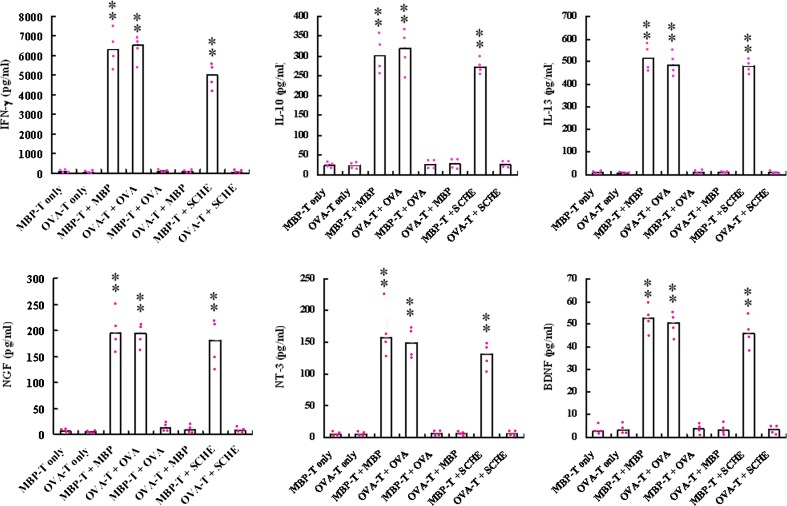
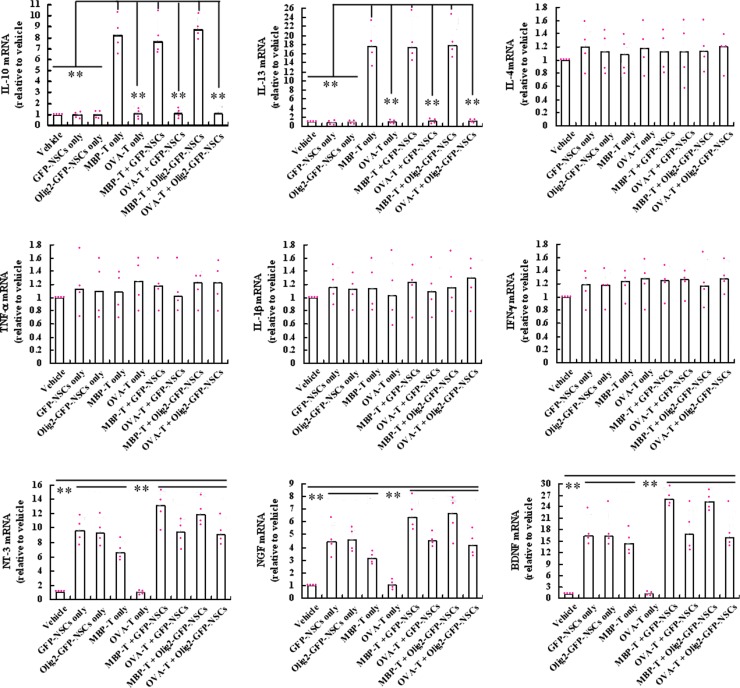
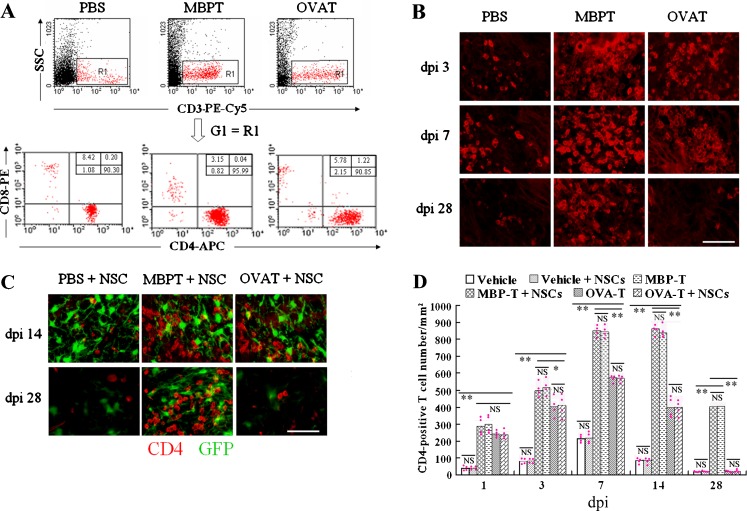
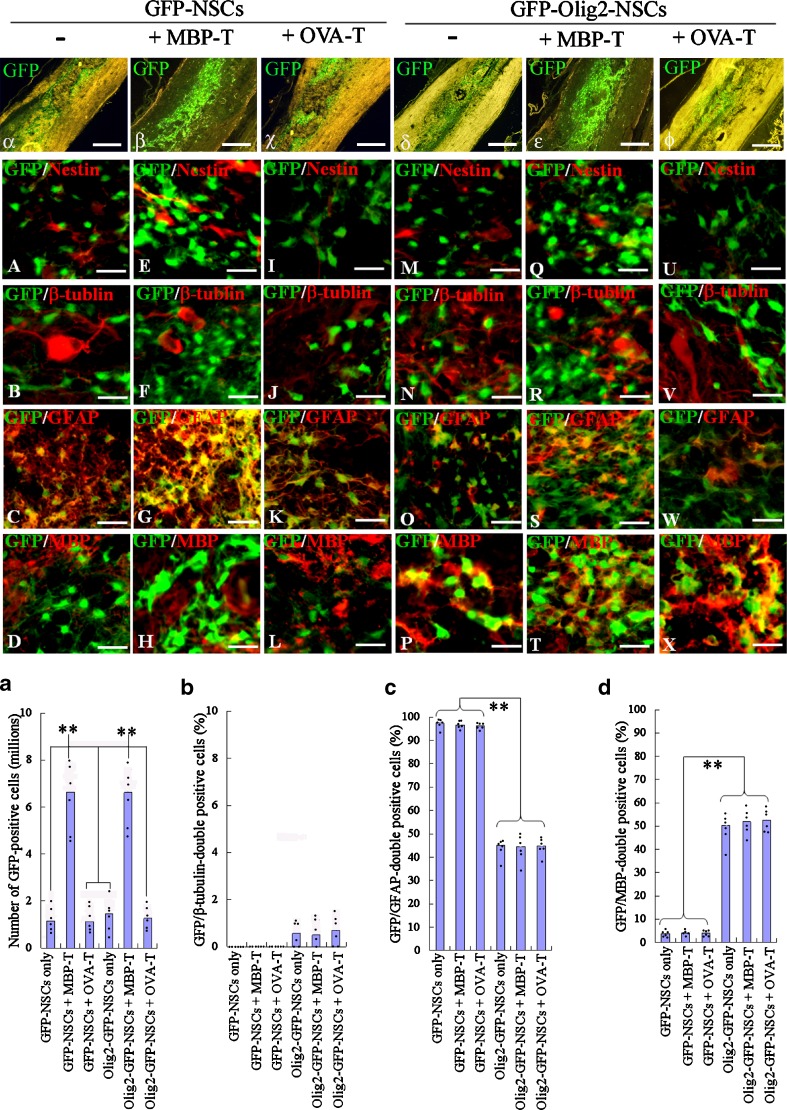
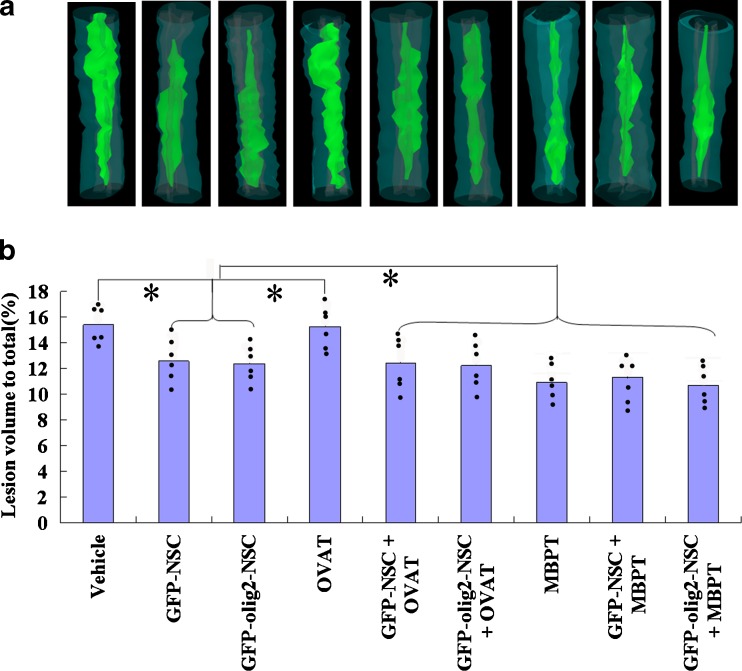
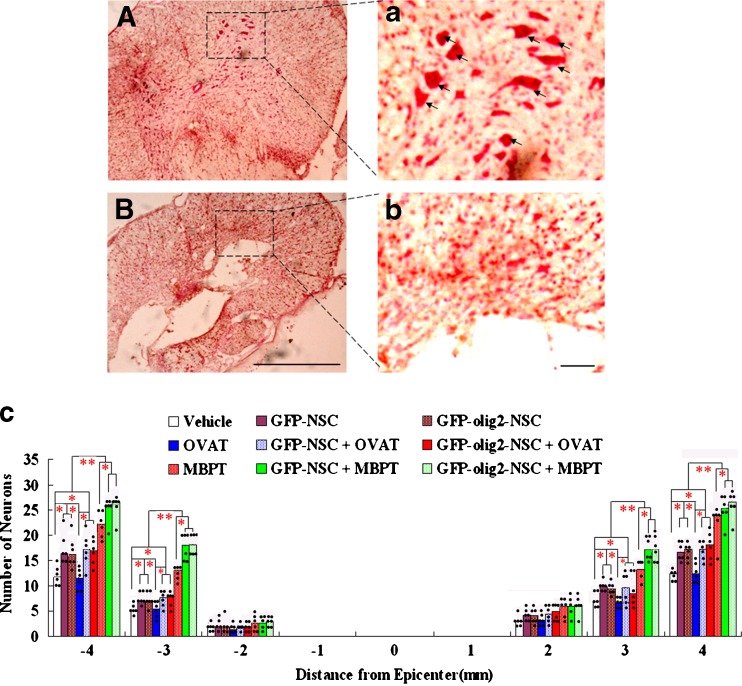
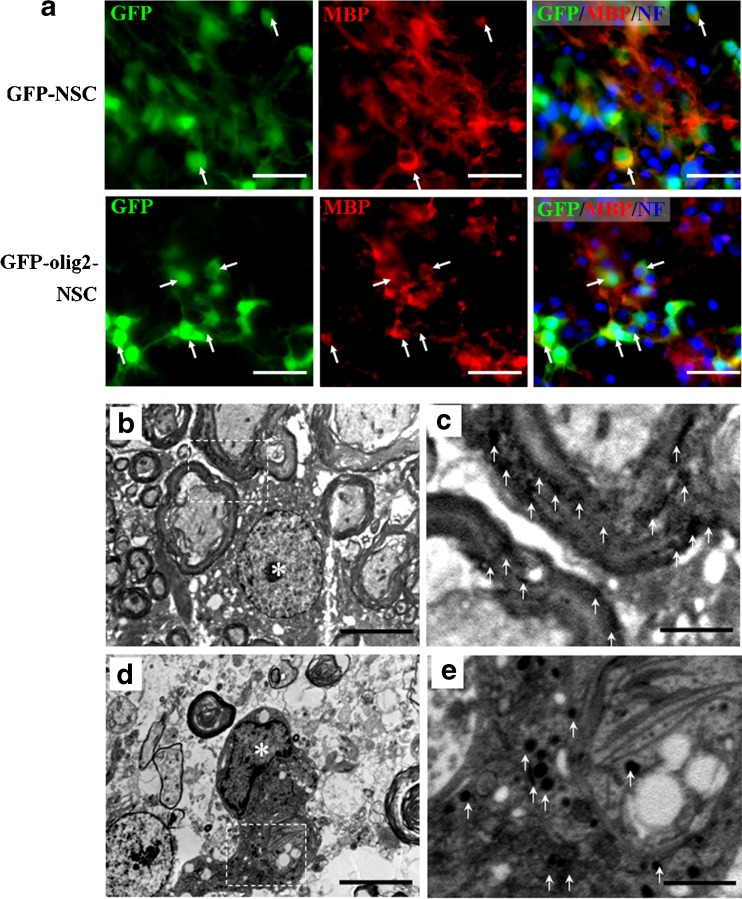
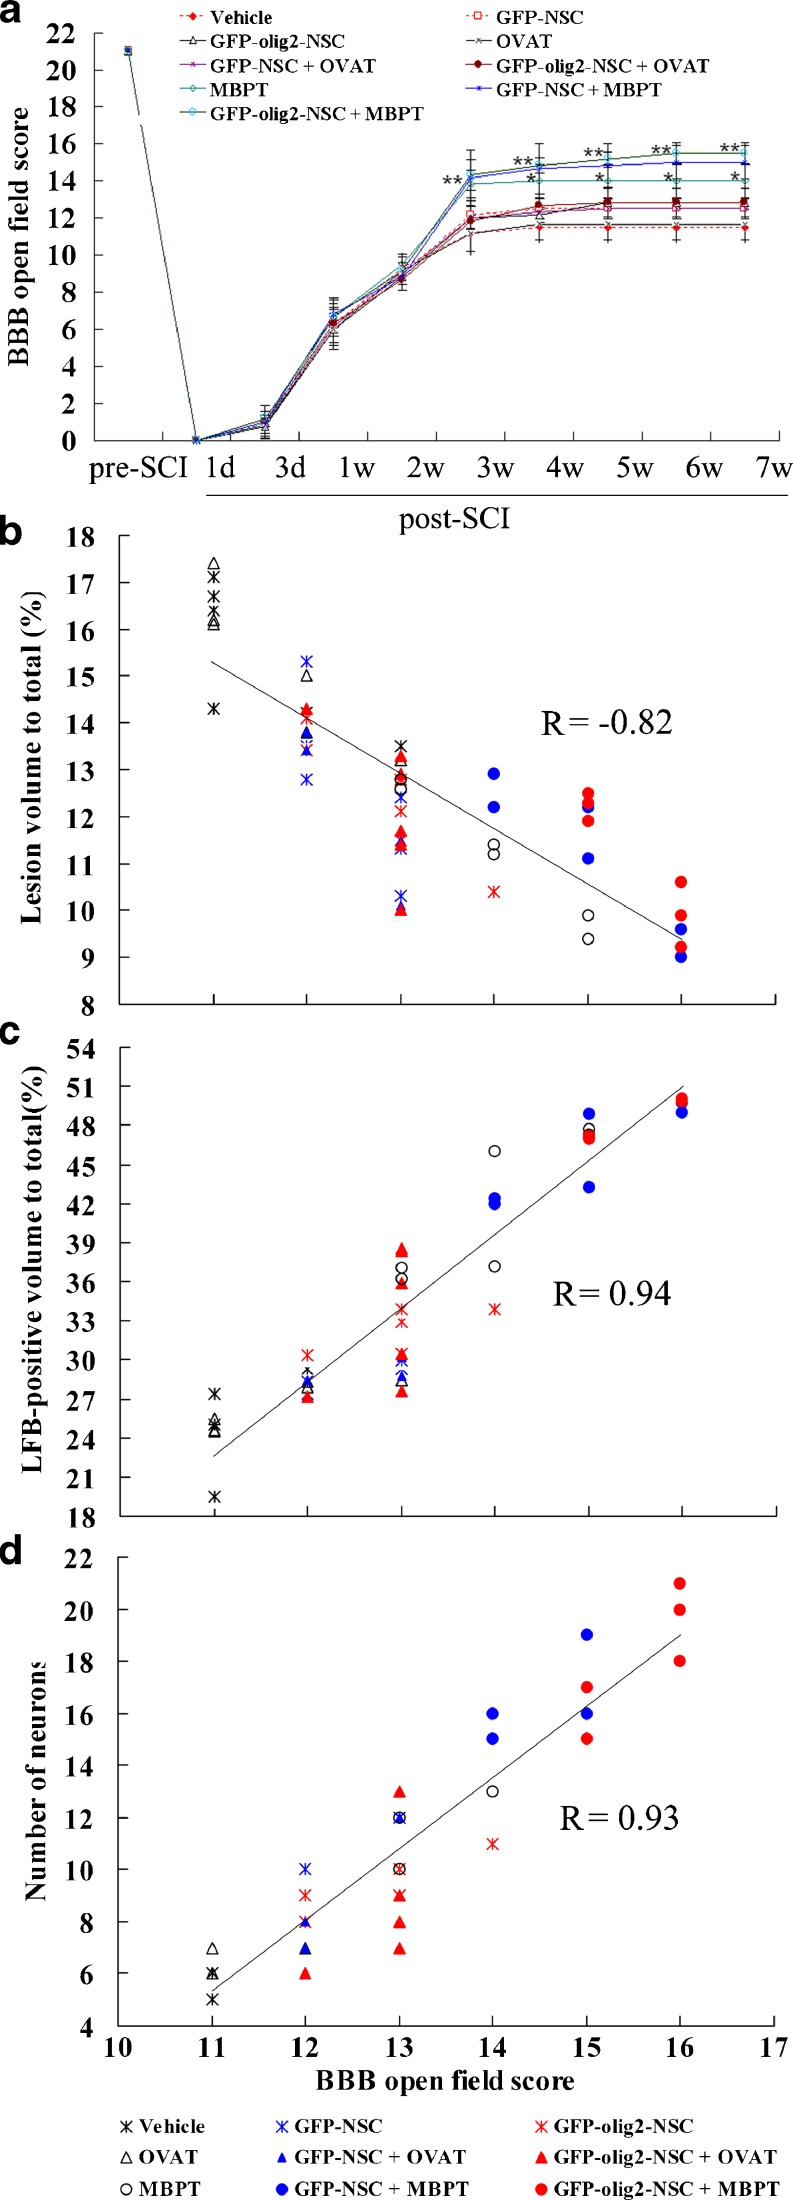
Neural stem cell (NSC) transplantation is a major focus of current research for treatment of spinal cord injury (SCI). However, it is very important to promote the survival and differentiation of NSCs into myelinating oligodendrocytes (OLs). In this study, myelin basic protein-activated T (MBP-T) cells were passively immunized to improve the SCI microenvironment. Olig2-overexpressing NSCs were infected with a lentivirus carrying the enhanced green fluorescent protein (GFP) reporter gene to generate Olig2-GFP-NSCs that were transplanted into the injured site to differentiate into OLs. Transferred MBP-T cells infiltrated the injured spinal cord, produced neurotrophic factors, and induced the differentiation of resident microglia and/or infiltrating blood monocytes into an "alternatively activated" anti-inflammatory macrophage phenotype by producing interleukin-13. As a result, the survival of transplanted NSCs increased fivefold in MBP-T cell-transferred rats compared with that of the vehicle-treated control. In addition, the differentiation of MBP-positive OLs increased 12-fold in Olig2-GFP-NSC-transplanted rats compared with that of GFP-NSC-transplanted controls. In the MBP-T cell and Olig2-GFP-NSC combined group, the number of OL-remyelinated axons significantly increased compared with those of all other groups. However, a significant decrease in spinal cord lesion volume and an increase in spared myelin and behavioral recovery were observed in Olig2-NSC- and NSC-transplanted MBP-T cell groups. Collectively, these results suggest that MBP-T cell adoptive immunotherapy combined with NSC transplantation has a synergistic effect on histological and behavioral improvement after traumatic SCI. Although Olig2 overexpression enhances OL differentiation and myelination, the effect on functional recovery may be surpassed by MBP-T cells.


Figures

Fig. 1
Fig. 1
The characteristics of nontransfected, green fluorescent protein (GFP)-transfected, and Olig2-GFP-transfected neural stem cells (NSCs) are shown. The characteristics of nontransfected (−), GFP-transfected (GFP), and Olig2-GFP-transfected (Olig2-GFP) NSCs were identified by immunostaining. (A) All gene-modified NSCs express GFP (green, A5-8, 17–20). Cells in neurosphere sections are immuno-positive for nestin (red, A1, 9, 21). After culture in NSC differentiation medium for 7 days, NSCs differentiate into neurons (βIII-tubulin+, A2, 10, 22), astrocytes (GFAP+, A3, 11, 23), and OLs (myelin basic protein [MBP]+, A4, 12, 24). Co-localization of cell specific markers (red) and GFP (green) in NSCs and their derivatives are shown in overlay images (yellow, A13-16, 25–28). Cells were counterstained with Hoechst 33342 (blue), a nuclear dye. Scale bars: 25 μm. (B) Preceding the differentiation experiments, Western blot analysis of Olig2 was performed using cell lysates of the 3 NSC types. (C) Statistical graphs show the proportion of nestin-, βIII-tubulin-, GFAP- and MBP-positive cells in various groups. Data are median values (histograms) and individual data points (dots); (n = 4); **p < 0.01
Fig. 2
Fig. 2
Phenotypes and specificities of myelin basic protein (MBP)- and ovalbumin-reactive (OVA)-T cells are shown. (A) Flow cytometric analysis shows that >98% of MBP- and OVA-T cells are CD3+CD4+ T cells; (B) MBP- and OVA-T cells were cultured in RPMI = Roswell Park Memorial Institute 1640 medium only (−), stimulated by MBP, spinal cord homogenate extract (rSCHE), gpSCHE and a non-central nervous system antigen (bovine serum albumin) to show reactivity as detected by 3H-TdR=3H-thymidine incorporation. Data are median values (histograms) and individual data points (dots); (n = 4); **p < 0.01. BSA = bovine serum albumin
Fig. 3
Fig. 3
Cytokine and neurotrophin production by spinal cord homogenate extract (rSCHE)-stimulated myelin basic protein-activated T (MBP-T) cells in vitro. MBP- and ovalbumin-reactive activated T (OVA-T) cells were stimulated with rSCHE or their immunized antigens for 2 days in vitro. Concentrations of interferon (IFN)-γ, interleukin (IL)-4, IL-10, IL-13, brain-derived neurotrophic factor (BDNF), nerve growth factor (NGF), and neurotrophin-3 (NT-3) in medium supernatants were measured using enzyme-linked immunosorbent assays (ELISAs). Data are median values (histograms) and individual data points (dots); (n = 4); **p < 0.01. SCHE = spinal cord homogenate extract
Fig. 4
Fig. 4
Cytokine and neurotrophin mRNA expression in injured spinal cords is shown. mRNA expression was measured by real-time RT-PCR. Relative expression levels of target mRNA in various tissue samples was calculated based on the ΔΔCt method. Data are expressed relative to the injured spinal cord without T-cell transfer, which is designated as one. Data are median values (histograms) and individual data points (dots); (n = 4); **p < 0.01. BDNF = brain-derived neurotrophic factor; GFP-NSCs=green fluorescent protein erexpressing Neural Stem Cells; IL = interleukin; MBP = myelin basic protein; NGF = nerve growth factor; OVA-T = ovalbumin-reactive activated T; TNF= tumor necrosis factor
Fig. 5
Fig. 5
T-cell infiltration into the injured spinal cords is shown. (a) Infiltrating cells in spinal cords were isolated by Percoll gradient centrifugation, and phenotypes were determined by flow cytometry. (b, c) T-cell infiltration into injured spinal cords was further examined by CD4 immunofluorescence staining of spinal cord sections. (b) Representative images of control, MBP- and OVA-T cell-transferred groups without NSC transplantation at 3, 7 and 28 dpi. Scale bars: 25 μm. (c) Representative images of control, MBP- and OVA-T cell-transferred groups with NSC transplantation at 14 and 28 dpi (5 days and 19 days post-NSC transplantation). Scale bars: 25 μm. (d) Statistical graphs indicate that the trends of T cell infiltration are similar in all groups. Data are median values (histograms) and individual data points (dots); (n = 4); *p < 0.05; **p < 0.01. APC=allophycocyanin; GFP = green fluorescent protein; MBPT = myelin basic protein-activated T; NSCs = neural stem cells; OVAT = ovalbumin-reactive activated T; PBS = phosphate-buffered saline
Fig. 6
Fig. 6
Polarization of central nervous system macrophages in the injured spinal cord are shown. Phenotypes of distinct macrophage subsets in injured spinal cord were examined by flow cytometry and immunohistochemistry. (a) Among CD68+ macrophages, CD86+CD163-, and CD86-CD163+, the subpopulations are M1 and M2 macrophages, respectively. (b-e) M1 and M2 macrophages in the spinal cord sections were determined by CC-chemokine receptor 7 and arginase I immunofluorescence staining, respectively. Scale bars: 25 μm. (f) Statistical graphs show the trends of M1 and M2 macrophages in various groups. Data are median values (histograms) and individual data points (dots); (n = 4); **p < 0.01. (g) Statistical graphs show the ratio of M1:M2 cells in various groups (**p < 0.01). GFP = green fluorescent protein; MBPT = myelin basic protein-activated T; NSCs = neural stem cells; OVAT = ovalbumin-reactive activated T; PBS = phosphate-buffered saline
Fig. 7
Fig. 7
The survival and differentiation of neural stem cells (NSCs) after 2 weeks of transplantation into injured spinal cords are shown. Two weeks after cell transplantation, the survival and differentiation of transplanted cells were detected in sagittal sections of injured spinal cord. (α β χ δ ε and ϕ Representative low-power images show the survival and distribution of transplanted cells (green). Scale bar = 1 mm. (A-X) Representative merged images show surviving green fluorescent protein (GFP)-positive cells and their differentiation fate. Cell specific markers (nestin, βIII-tubulin, glial fibrillary acidic protein [GFAP], and myelin basic protein [MBP]) are red. Cell specific markers and GFP (green)-double positive cells are yellow. Scale bar = 25 μm. (a-d) Statistical graphs show the number of GFP-positive cells (a), percentages of nestin (b), GFAP (c), and MBP (d) positive cells in GFP-positive cells. Data are median values (histograms) and individual data points (dots); (n = 6); **p < 0.01. MBP-T = myelin basic protein-activated-T; OVA-T = ovalbumin-reactive activated-T
Fig. 8
Fig. 8
Three-dimensional reconstruction of lesion volumes after 7 weeks of contusive spinal cord injury is shown. (A) Representative images of a three-dimensional reconstruction of a 10-mm spinal cord segment containing the lesion cavity (green). Spinal cord contours and white matter are shown in semitransparent blue, and gray matter is depicted in gray. (B) Data are median values (histograms) and individual data points (dots); (n = 6); *p < 0.05. GFP-NSC = green fluorescent protein neural stem cells; MBPT = myelin basic protein-activated T; NSC = neural stem cells; OVAT = ovalbumin-reactive activated T
Fig. 9
Fig. 9
Survival of motoneurons in the spinal cord ventral horn (VH) after 7 weeks of contusive spinal cord injury is shown. (A, a, B, and b) Neutral red staining shows VH neurons in sections from the myelin basic protein-activated T (MBPT)-cell-transferred group, some VH neurons (arrows) remain intact in a section 8-mm rostral to the epicenter (A, a), whereas at the injury epicenter (B, b) neurons were not found. Scale bar in (A and B) = 1 mm and (a and b) = 25 μm. (C) Comparison of VH neurons among groups at various distances from the injury epicenter (0), as well as at 1-, 2-, 3-, at 4-mm rostral (+) and caudal (−) to the epicenter. Data are median values (histograms) and individual data points (dots); (n = 6); *p < 0.05, **p < 0.01. GFP = green fluorescent protein; NSC = neural stem cells; OVAT = ovalbumin-reactive activated T
Fig. 10
Fig. 10
Quantifications of residual myelination in the injured spinal cord after 7 week of contusive spinal cord injury is shown. (A) Luxol fast blue-stained cross-sections of a spinal cord taken from the injury epicenter (0), as well as at 1-, 2-, 3-, 4-mm rostral (+) and caudal (−) to the epicenter. (B) Comparison of residual myelination among groups at various distances from the injury epicenter. Data are median values (histograms) and individual data points (dots); (n = 6); **p < 0.01. GFP = green fluorescent protein; MBPT = myelin basic protein-activated T; NSC = neural stem cells; OVAT = ovalbumin-reactive activated T
Fig. 11
Fig. 11
Quantifications of oligodendrocyte (OL)- and Schwann cell (SC)-remyelinated axons in the injured spinal cords after 7 weeks of contusive spinal cord injury are shown. (A) Representative photomicrographs of toluidine blue-stained sections taken from the middle of the lesion and pial borders. OL-remyelinated (arrowheads) and SC-remyelinated axons (arrows) are identified by their myelin sheaths relative to the axon diameter. (B) Statistical graphs show the number of OL- and SC-remyelinated axons in 4 random 10 × 40-fold microscope views in the middle of the lesion and pial borders in the dorsal, lateral, and ventral columns. Data are median values (histograms) and individual data points (dots); (n = 6); *p < 0.05, **p < 0.01. GFP = green fluorescent protein; MBPT = myelin basic protein-activated T; NSC = neural stem cells; OVAT = ovalbumin-reactive activated T
Fig. 12
Fig. 12
Transplanted Olig2-overexpressing neural stem cells (NSCs) remyelinate axons in the injured spinal cord are shown. (A) Transplanted NSCs differentiate into mature myelin basic protein (MBP)-positive oligodendrocyte (OLs) (red) at various proportions (arrows), which form myelin rings around neurofilament (NF) M-positive axons (blue). (B-E) Immuno-electron microscopy (immuno-EM) confirmed transplanted NSC-derived OL remyelination. In green fluorescent protein (GFP)-Olig2-NSC-transplanted groups (B, C), GFP-positive cells (B, asterisk) show ultrastructural characteristics of mature OLs. GFP immunoreactivity is directly detected in myelin at higher magnifications (C, arrows). However, in GFP-NSC-transplanted groups (D, E), although GFP-positive cells are found (D, asterisk), GFP-positive cells showing ultrastructural characteristics of mature OLs are very infrequent. GFP immunoreactivity is mainly detected in cell bodies at higher magnifications (E, arrows). Scale bars in (A): 25 μm, in (B and D): 10 μm, and in (C and E): 25 μm
Fig. 13
Fig. 13
Basso, Beattie, and Bresnahan (BBB) tests showing the effect of myelin basic protein-activated-T (MBP-T)-cell transfer and Olig2-overexpressing neural stem cell (NSC) transplantation on functional recovery following spinal cord injury (SCI). (A) BBB scores of the 9 groups were compared. Data are means ± standard deviation (n = 12; *p < 0.05). (B-D) Correlational analysis of behavioral scores and total lesion (B), volume of residual myelin at the epicenter (C), and numbers of ventral horn (VH) motor neurons at 3-mm rostral to the epicenter (D). Six rats in each group were analyzed (n = 54). GFP = green fluorescent protein; LFB = luxol fast blue; OVAT = ovalbumin-reactive activated T

Similar articles

Cited by

References

    1. Nandoe Tewarie RS, Hurtado A, Bartels RH, Grotenhuis A, Oudega M. Stem cell-based therapies for spinal cord injury. J Spinal Cord Med. 2009;32:105–114. - PMC - PubMed
    1. Karimi-Abdolrezaee S, Eftekharpour E, Wang J, Morshead CM, Fehlings MG. Delayed transplantation of adult neural precursor cells promotes remyelination and functional neurological recovery after spinal cord injury. J Neurosci. 2006;26:3377–3389. doi: 10.1523/JNEUROSCI.4184-05.2006. - DOI - PMC - PubMed
    1. Thuret S, Moon LD, Gage FH. Therapeutic interventions after spinal cord injury. Nat Rev Neurosci. 2006;7:628–643. doi: 10.1038/nrn1955. - DOI - PubMed
    1. Xu XM, Onifer SM. Transplantation-mediated strategies to promote axonal regeneration following spinal cord injury. Respir Physiol Neurobiol. 2009;169:171–182. doi: 10.1016/j.resp.2009.07.016. - DOI - PMC - PubMed
    1. Cao QL, Zhang YP, Howard RM, Walters WM, Tsoulfas P, Whittemore SR. Pluripotent stem cells engrafted into the normal or lesioned adult rat spinal cord are restricted to a glial lineage. Exp Neurol. 2001;167:48–58. doi: 10.1006/exnr.2000.7536. - DOI - PubMed

Publication types

MeSH terms

Substances