

Quantitative evaluation of C-arm CT cerebral blood volume in a canine model of ischemic stroke
- PMID: 22173756
- PMCID: PMC7964819
- DOI: 10.3174/ajnr.A2944
Quantitative evaluation of C-arm CT cerebral blood volume in a canine model of ischemic stroke
Abstract
Background and purpose: Previous studies have shown the feasibility of assessing qualitative CBV measurements in the angiography suite by using FPD-CBCT systems. We have investigated the correlation of FPD-CBCT CBV lesion volumes to the infarct volume.
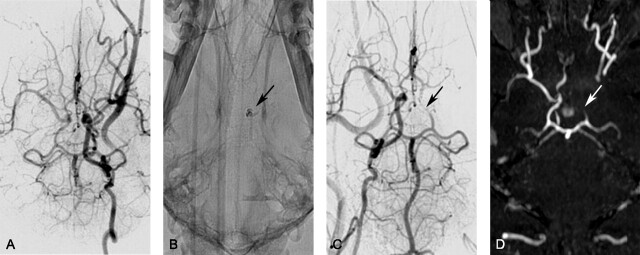
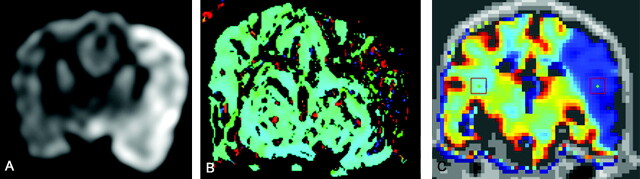
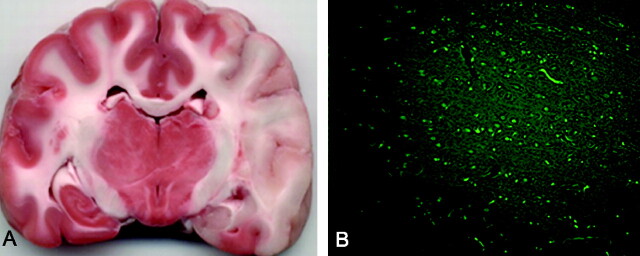
Materials and methods: Unilateral strokes were created in 7 adult dogs. MR imaging and FPD-CBCT data were obtained after MCA occlusion. FPD-CBCT CBV and ADC maps were generated for all subjects. The animals were sacrificed immediately following the last imaging study to measure infarct volume on histology. The reliability of FPD-CBCT-based lesion volume measurements was compared with those measured histologically by using regression and Bland-Altman analysis.
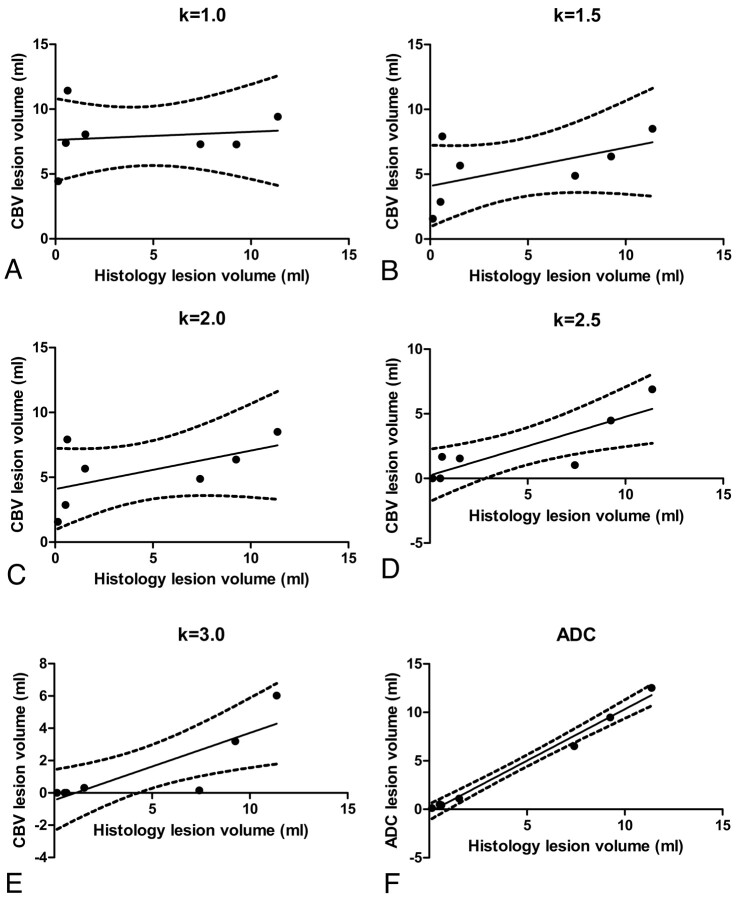
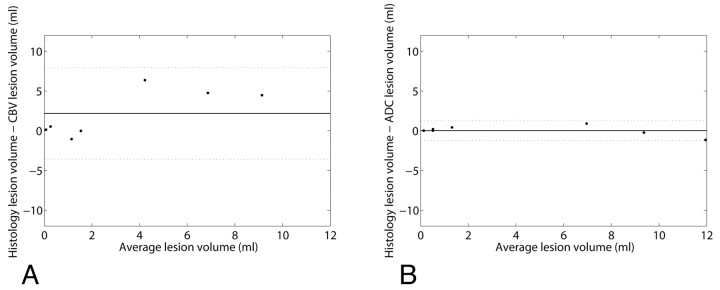
Results: The best correlation (R(2) = 0.72) between lesion volumes assessed with FPD-CBCT and histology was established with a threshold of mean healthy CBV - 2.5 × SD. These results were inferior to the correlation of lesion volumes measured with ADC and histology (R(2) = 0.99). Bland-Altman analysis showed that the agreement of ADC-derived lesion volumes with histology was superior to the agreement of FPD-CBCT-derived lesion volumes with histology.
Conclusions: We correlated FPD-CBCT measurements of CBV and MR ADC lesion volumes with histologically assessed infarct volume. As expected, ADC is a very accurate and precise method for determining the extent of infarction. FPD-CBCT CBV lesion volumes are correlated to the size of the infarct. Improvement of FPD-CBCT image quality provides an opportunity to establish quantitative CBV measurement in the angiography suite.
Figures
Similar articles
-
C-arm CT measurement of cerebral blood volume and cerebral blood flow using a novel high-speed acquisition and a single intravenous contrast injection.AJNR Am J Neuroradiol. 2013 Nov-Dec;34(11):2131-8. doi: 10.3174/ajnr.A3536. Epub 2013 May 23. AJNR Am J Neuroradiol. 2013. PMID: 23703149 Free PMC article.
-
C-arm CT measurement of cerebral blood volume in ischemic stroke: an experimental study in canines.AJNR Am J Neuroradiol. 2010 Mar;31(3):536-40. doi: 10.3174/ajnr.A1851. Epub 2010 Jan 6. AJNR Am J Neuroradiol. 2010. PMID: 20053809 Free PMC article.
-
In Acute Stroke, Can CT Perfusion-Derived Cerebral Blood Volume Maps Substitute for Diffusion-Weighted Imaging in Identifying the Ischemic Core?PLoS One. 2015 Jul 20;10(7):e0133566. doi: 10.1371/journal.pone.0133566. eCollection 2015. PLoS One. 2015. PMID: 26193486 Free PMC article.
-
The evolution of the cerebral blood volume abnormality in patients with ischemic stroke: a CT perfusion study.Acta Radiol. 2012 May 1;53(4):461-7. doi: 10.1258/ar.2012.110582. Epub 2012 Mar 20. Acta Radiol. 2012. PMID: 22434930
-
Comparison of perfusion computed tomography and computed tomography angiography source images with perfusion-weighted imaging and diffusion-weighted imaging in patients with acute stroke of less than 6 hours' duration.Stroke. 2004 Jul;35(7):1652-8. doi: 10.1161/01.STR.0000131271.54098.22. Epub 2004 May 20. Stroke. 2004. PMID: 15155964
Cited by
-
Large animals in neurointerventional research: A systematic review on models, techniques and their application in endovascular procedures for stroke, aneurysms and vascular malformations.J Cereb Blood Flow Metab. 2019 Mar;39(3):375-394. doi: 10.1177/0271678X19827446. Epub 2019 Feb 7. J Cereb Blood Flow Metab. 2019. PMID: 30732549 Free PMC article.
-
C-arm CT measurement of cerebral blood volume and cerebral blood flow using a novel high-speed acquisition and a single intravenous contrast injection.AJNR Am J Neuroradiol. 2013 Nov-Dec;34(11):2131-8. doi: 10.3174/ajnr.A3536. Epub 2013 May 23. AJNR Am J Neuroradiol. 2013. PMID: 23703149 Free PMC article.
-
Intraprocedural 3D perfusion measurement during chemoembolisation with doxorubicin-eluting beads in liver metastases of malignant melanoma.Eur Radiol. 2018 Apr;28(4):1456-1464. doi: 10.1007/s00330-017-5099-y. Epub 2017 Nov 9. Eur Radiol. 2018. PMID: 29124381 Clinical Trial.
-
Quantitative analysis of high-resolution, contrast-enhanced, cone-beam CT for the detection of intracranial in-stent hyperplasia.J Neurointerv Surg. 2015 Feb;7(2):118-25. doi: 10.1136/neurintsurg-2013-010950. Epub 2014 Jan 30. J Neurointerv Surg. 2015. PMID: 24480728 Free PMC article.
-
Large animal ischemic stroke models: replicating human stroke pathophysiology.Neural Regen Res. 2020 Aug;15(8):1377-1387. doi: 10.4103/1673-5374.274324. Neural Regen Res. 2020. PMID: 31997796 Free PMC article. Review.
References
-
- Saver JL. Time is brain: quantified. Stroke 2006;37:263–66 - PubMed
-
- Schaefer PW, Barak ER, Kamalian S, et al. . Quantitative assessment of core/penumbra mismatch in acute stroke: CT and MR perfusion imaging are strongly correlated when sufficient brain volume is imaged. Stroke 2008;39:2986–92 - PubMed
Publication types
MeSH terms
Grants and funding
LinkOut - more resources
Full Text Sources
Medical
Research Materials