

Differentiation of tumefactive demyelinating lesions from high-grade gliomas with the use of diffusion tensor imaging
- PMID: 22173757
- PMCID: PMC7968810
- DOI: 10.3174/ajnr.A2871
Differentiation of tumefactive demyelinating lesions from high-grade gliomas with the use of diffusion tensor imaging
Abstract
Background and purpose: TDLs may be indistinguishable from high-grade gliomas on conventional MR imaging. The role of DTI in differentiating TDLs from high-grade gliomas is not clear, and quantitative comparison between the 2 has not been reported. Here we aimed to differentiate TDLs from high-grade gliomas by using DTI.
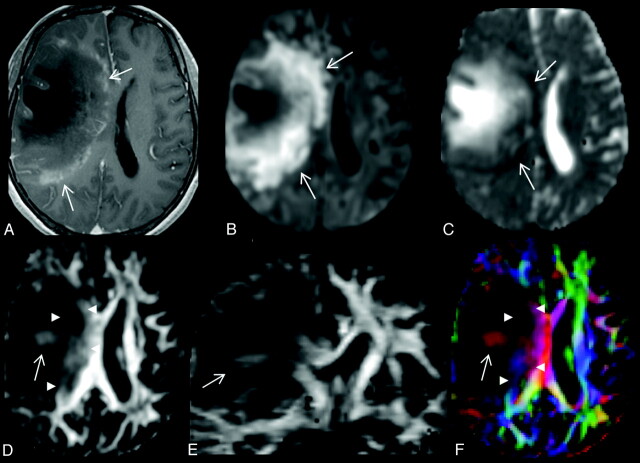
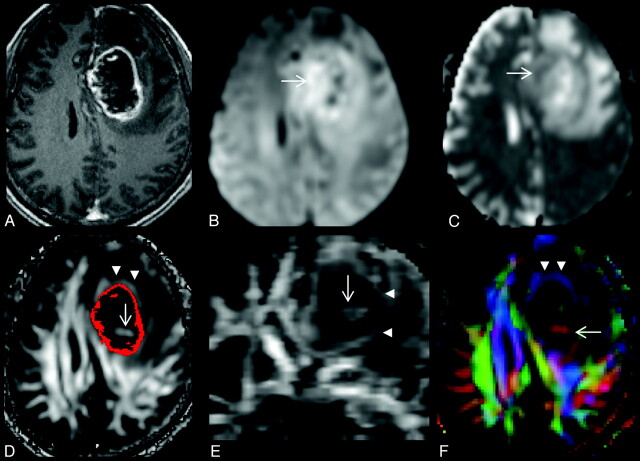
Materials and methods: DTI was performed in 8 TDLs and 13 high-grade gliomas. The presence of 3 findings (ie, intralesional hyperintensities on the FA map, restricted diffusion in the lesion periphery, and a perilesional hyperintense FA rim) was assessed by visual inspection. The FA and MD values were measured in the central nonenhancing portion, peripheral enhancing portion, and perilesional edema for each lesion and compared between the 2 groups respectively.
Results: TDLs had a significantly higher incidence of intralesional hyperintensities on FA maps (P = .049) but a lower incidence of a perilesional hyperintense FA rim (P < .001), compared with those of high-grade gliomas on visual inspection. TDLs had significantly higher FA (P = .004) and lower MD (P = .001) values in the peripheral enhancing portions of the lesions compared with those of high-grade gliomas. In perilesional edema, FA values were significantly higher in high-grade gliomas (P = .001).
Conclusions: DTI is helpful in differentiating TDLs from high-grade gliomas by using visual inspection and quantitative analysis.
Figures
Similar articles
-
Combining Diffusion Tensor Metrics and DSC Perfusion Imaging: Can It Improve the Diagnostic Accuracy in Differentiating Tumefactive Demyelination from High-Grade Glioma?AJNR Am J Neuroradiol. 2017 Apr;38(4):685-690. doi: 10.3174/ajnr.A5089. Epub 2017 Feb 16. AJNR Am J Neuroradiol. 2017. PMID: 28209583 Free PMC article.
-
MRI Findings in Tumefactive Demyelinating Lesions: A Systematic Review and Meta-Analysis.AJNR Am J Neuroradiol. 2018 Sep;39(9):1643-1649. doi: 10.3174/ajnr.A5775. Epub 2018 Aug 16. AJNR Am J Neuroradiol. 2018. PMID: 30115676 Free PMC article.
-
Performance of Apparent Diffusion Coefficient Values and Conventional MRI Features in Differentiating Tumefactive Demyelinating Lesions From Primary Brain Neoplasms.AJR Am J Roentgenol. 2015 Nov;205(5):1075-85. doi: 10.2214/AJR.14.13970. AJR Am J Roentgenol. 2015. PMID: 26496556 Free PMC article.
-
Diffusion-tensor imaging for glioma grading at 3-T magnetic resonance imaging: analysis of fractional anisotropy and mean diffusivity.J Comput Assist Tomogr. 2008 Mar-Apr;32(2):298-303. doi: 10.1097/RCT.0b013e318076b44d. J Comput Assist Tomogr. 2008. PMID: 18379322
-
High-definition fiber tractography for the evaluation of perilesional white matter tracts in high-grade glioma surgery.Neuro Oncol. 2015 Sep;17(9):1199-209. doi: 10.1093/neuonc/nov113. Epub 2015 Jun 27. Neuro Oncol. 2015. PMID: 26117712 Free PMC article. Review.
Cited by
-
Differential imaging of atypical demyelinating lesions of the central nervous system.Radiol Med. 2021 Jun;126(6):827-842. doi: 10.1007/s11547-021-01334-y. Epub 2021 Jan 24. Radiol Med. 2021. PMID: 33486703 Review.
-
Tumefactive multiple sclerosis versus high grade glioma: A diagnostic dilemma.Surg Neurol Int. 2022 Apr 15;13:146. doi: 10.25259/SNI_239_2022. eCollection 2022. Surg Neurol Int. 2022. PMID: 35509579 Free PMC article.
-
A Rare and Challenging Presentation of Acute Hemorrhagic Leukoencephalitis With Tumefactive Demyelinating Lesions in a 41-Year-Old Male.Cureus. 2024 Apr 15;16(4):e58282. doi: 10.7759/cureus.58282. eCollection 2024 Apr. Cureus. 2024. PMID: 38752096 Free PMC article.
-
Combining Diffusion Tensor Metrics and DSC Perfusion Imaging: Can It Improve the Diagnostic Accuracy in Differentiating Tumefactive Demyelination from High-Grade Glioma?AJNR Am J Neuroradiol. 2017 Apr;38(4):685-690. doi: 10.3174/ajnr.A5089. Epub 2017 Feb 16. AJNR Am J Neuroradiol. 2017. PMID: 28209583 Free PMC article.
-
MRI Findings in Tumefactive Demyelinating Lesions: A Systematic Review and Meta-Analysis.AJNR Am J Neuroradiol. 2018 Sep;39(9):1643-1649. doi: 10.3174/ajnr.A5775. Epub 2018 Aug 16. AJNR Am J Neuroradiol. 2018. PMID: 30115676 Free PMC article.
References
-
- Dagher AP, Smirniotopoulos J. Tumefactive demyelinating lesions. Neuroradiology 1996;38:560–65 - PubMed
-
- Peterson K, Rosenblum MK, Powers JM, et al. . Effect of brain irradiation on demyelinating lesions. Neurology 1993;43:2105–12 - PubMed
-
- Given CA, 2nd, Stevens BS, Lee C. The MRI appearance of tumefactive demyelinating lesions. AJR Am J Roentgenol 2004;182:195–99 - PubMed
-
- Masdeu JC, Quinto C, Olivera C, et al. . Open-ring imaging sign: highly specific for atypical brain demyelination. Neurology 2000;54:1427–33 - PubMed
Publication types
MeSH terms
LinkOut - more resources
Full Text Sources
Medical