

Dantrolene rescues arrhythmogenic RYR2 defect in a patient-specific stem cell model of catecholaminergic polymorphic ventricular tachycardia
- PMID: 22174035
- PMCID: PMC3376852
- DOI: 10.1002/emmm.201100194
Dantrolene rescues arrhythmogenic RYR2 defect in a patient-specific stem cell model of catecholaminergic polymorphic ventricular tachycardia
Abstract
Coordinated release of calcium (Ca(2+) ) from the sarcoplasmic reticulum (SR) through cardiac ryanodine receptor (RYR2) channels is essential for cardiomyocyte function. In catecholaminergic polymorphic ventricular tachycardia (CPVT), an inherited disease characterized by stress-induced ventricular arrhythmias in young patients with structurally normal hearts, autosomal dominant mutations in RYR2 or recessive mutations in calsequestrin lead to aberrant diastolic Ca(2+) release from the SR causing arrhythmogenic delayed after depolarizations (DADs). Here, we report the generation of induced pluripotent stem cells (iPSCs) from a CPVT patient carrying a novel RYR2 S406L mutation. In patient iPSC-derived cardiomyocytes, catecholaminergic stress led to elevated diastolic Ca(2+) concentrations, a reduced SR Ca(2+) content and an increased susceptibility to DADs and arrhythmia as compared to control myocytes. This was due to increased frequency and duration of elementary Ca(2+) release events (Ca(2+) sparks). Dantrolene, a drug effective on malignant hyperthermia, restored normal Ca(2+) spark properties and rescued the arrhythmogenic phenotype. This suggests defective inter-domain interactions within the RYR2 channel as the pathomechanism of the S406L mutation. Our work provides a new in vitro model to study the pathogenesis of human cardiac arrhythmias and develop novel therapies for CPVT.
Copyright © 2012 EMBO Molecular Medicine.
Figures
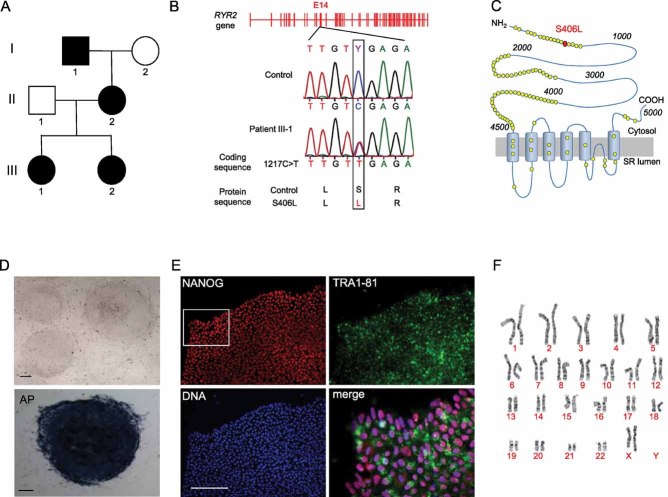
Pedigree of the CPVT-affected patient (III-1) showing autosomal dominant inheritance in the family.
Sequence analysis of RYR2 gene in fibroblasts from control and CPVT patient, revealing a novel heterozygous missense mutation in exon 14 (position 1217C > T of the coding sequence). Same results were obtained from all analysed control and CPVT-iPSC clones.
Schematic representation of RYR2 channel and localization of the S406L mutation (red circle) at the N-terminal domain. Yellow circles indicate reported putative pathogenic mutations.
Representative images of CPVT-iPSC colonies in bright field (top, clone a) and after staining for alkaline phosphatase (AP) activity (bottom, clone c). Scale bars, 100 µm.
Representative images of a CPVT-iPSC colony (clone b) after immunostaining for the pluripotency markers NANOG (red) and TRA1-81 (green). Merged image is the magnified area marked by the white box. Scale bars, 100 µm.
Karyogram of CPVT-iPSC clone a.
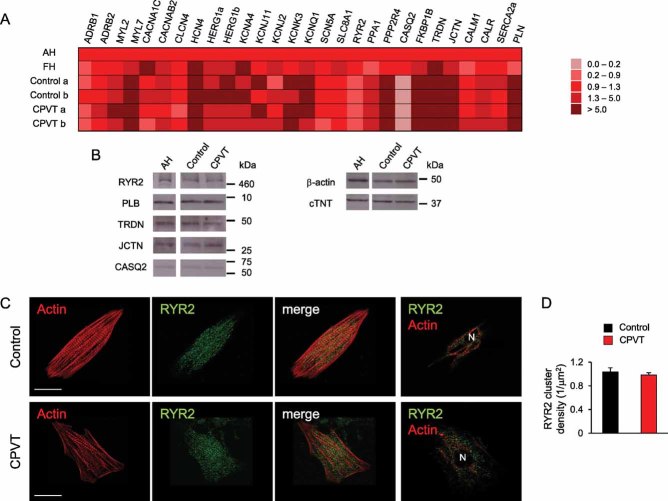
Comparison of transcriptional profile of 2-month-old iPSC-derived cardiac explants, human adult (AH) and fetal (FH) heart tissue. qRT-PCR analysis was performed on 28 key genes involved in cardiomyocyte EC-coupling. All values are normalized for TNNT2 and relative to AH tissue.
Western blot of whole cell extracts from 3 to 4-month-old iPSC-derived cardiac explants and human adult heart tissue (AH). Cardiac troponin T (cTNT) and β-actin were used as loading controls.
Confocal immunofluorescence images of RYR2 (green) and actin (red) in human cardiomyocytes generated from control (top) and CPVT-iPSCs (bottom). Actin is marked by phalloidin. From left to right, the third panels display the merged image of the first two panels and the last panels depict RYR2 and actin expression patterns in a optical section at the nuclear plane. N indicates the cell nucleus. Scale bars, 15 µm.
RYR2 cluster density in cardiomyocytes derived from control (black) and CPVT-iPSCs (red) (n = 17 in each group).
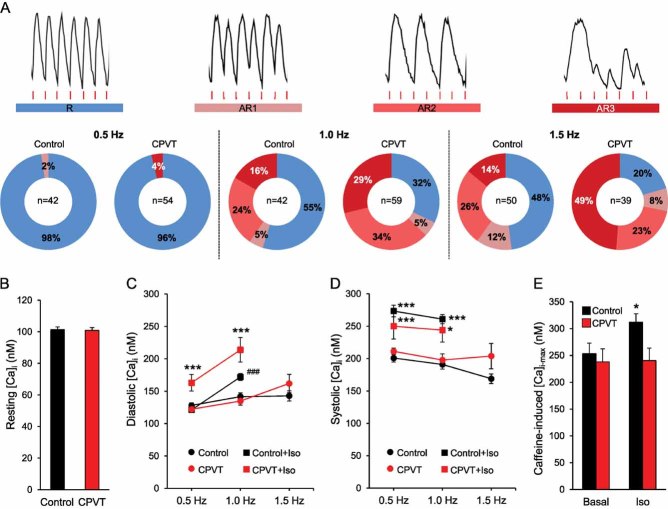
A. Images of Fura-2 Ca2+ recordings depicting normal (R) and aberrant (AR1, AR2 and AR3) Ca2+ cycling in electrically stimulated iPSC-derived myocytes (top, from CPVT cells) and their percentage occurrence during pacing at either 0.5, 1.0 or 1.5 Hz (bottom). Red lines indicate electric stimulation and n the number of cells analysed.
B. Bar graphs comparing the average resting intracellular Ca2+ ([Ca2+]i) before electrical stimulation started in control (black, n = 191) and CPVT (red, n = 211) myocytes from three different iPCS lines per group. Data are means ± SEM from four independent differentiation experiments.
C,D. Average of diastolic and systolic [Ca2+]i in control (black) and CPVT (red) rhythmic myocytes during sequential pacing at 0.5, 1.0 and 1.5 Hz in absence (circles) and in presence (squares) of 10 µM isoproterenol. Between 4 and 42 cells were analysed per group; no rhythmic cells were observed with isoproterenol at 1.5 Hz. Data are means ± SEM. ***p < 0.001 versus CPVT and Control + Iso, ###p = 0.001 versus Control in C; *p = 0.04, ***p < 0.001 versus same group without isoproterenol in D; two-tailed t-test.
E. Average (±SEM) of maximum caffeine-induced [Ca2+]i as measurement of SR Ca2+ content, in control (black) and CPVT (red) myocytes in absence (basal, n = 33 vs. n = 8 cells) and in presence of isoproterenol (n = 24 vs. n = 17 cells); *p = 0.03 versus control basal and CPVT + Iso, two-tailed t-test.
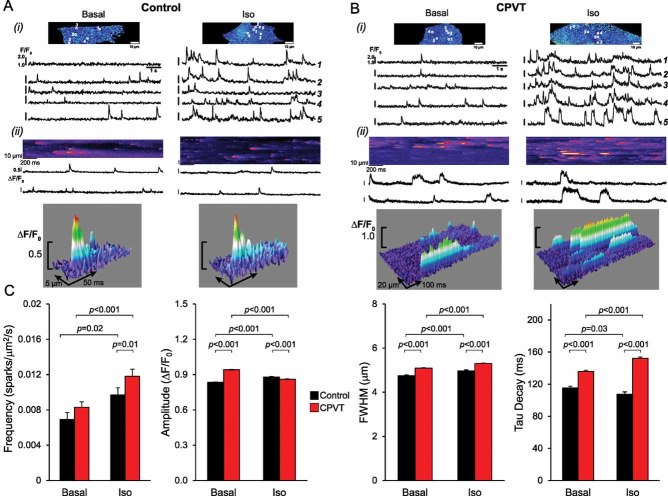
A,B. Panel (i) shows representative pseudo-coloured images of fluo-4-AM loaded control (A) and CPVT (B) myocytes in the absence (left) or in the presence (right) of 1 µM isoproterenol. Below, typical Ca2+ traces, recorded at 105 images/s, corresponding to each of the five individual regions of interest marked in the top images. Panel (ii) displays original line-scan images of Ca2+ sparks at a higher temporal resolution (1000 lines/s, top), a portion of the corresponding Ca2+ traces (middle), and 3D surface plots of representative Ca2+ sparks (bottom), highlighting the extended time course of CPVT-sparks.
C. Summary of Ca2+ spark characteristics from control (black) and CPVT (red) myocytes in absence (basal) or presence of 1 µM isoproterenol. FWHM, full width at half maximum. Between 38 and 142 cells from three iPSC lines were analysed per group. Data are means ± SEM from four independent experiments; p-values from two-tailed t-test.
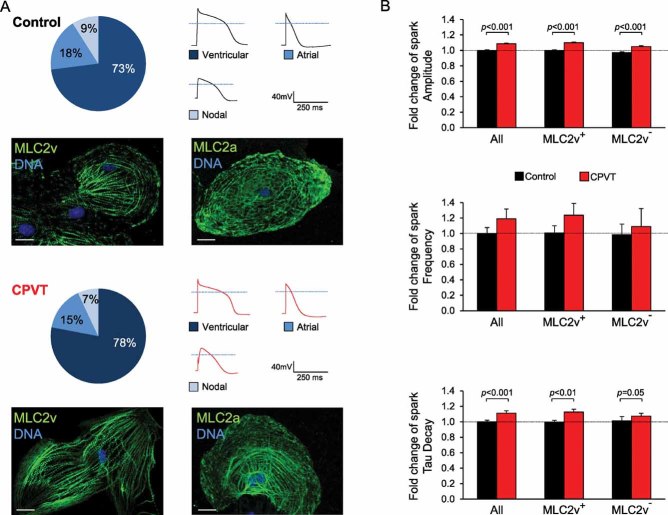
Percentage of ventricular-, atrial- and nodal-like myocytes after 3–4 month cardiac iPSC differentiation based on single cell electrophysiological measurements of action potentials (n = 47–50 cells) and expression of specific myocytic lineage markers (MLC2v, for ventricular cells, and MLC2a, for atrial cells) by immunohistochemistry (n = 100 cells). Scale bars, 10 µm. Dotted lines in the action potential traces indicate 0 mV.
Summary of Ca2+ spark characteristics from control (black) and CPVT (red) cells under basal conditions when all myocytes or specifically ventricular (MLC2v+) and non-ventricular (MLC2v−) subtypes are analysed. Fold changes are relative to all myocytes control. Staining for MLC2v was performed after Ca2+ spark imaging. Between 21 and 113 cells from three iPSC lines were analysed per group. Data are means ± SEM from three independent experiments; p-values from two-tailed t-test.
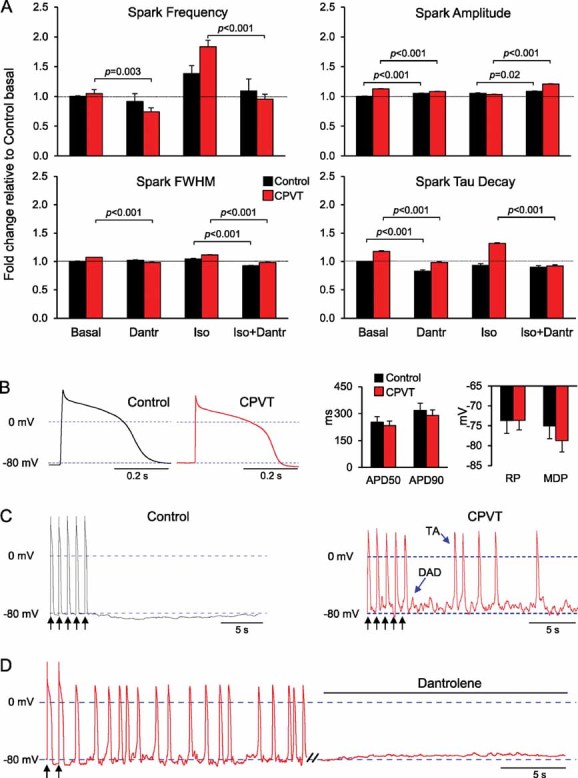
Fold change of Ca2+ spark characteristics relative to control cells under basal conditions in control (black) and CPVT (red) myocytes after treatment with 10 µM dantrolene alone, 1 µM isoproterenol alone or both drugs combined. Between 32 and 142 cells from three iPSC lines were analysed per group. Data are means ± SEM from four independent experiments; p-values from one-way ANOVA followed by Tukey's test.
Representative traces of electrically evoked action potentials from control (black) and CPVT (red) ventricular myocytes (left) and bar graphs of the averaged action potential duration at 50% (APD50) and 90% (APD90) repolarization, the maximum diastolic potential and the resting potential (right) during stimulation at 1 Hz.
Typical action potential recordings from a control (black) and a CPVT (red) ventricular myocyte. Black arrows indicate the last five paced action potentials at 1 Hz stimulation; blue arrows mark an example of DAD and triggered activity.
Representative action potential recording from a CPVT ventricular cell showing that superfusion with 10 µM dantrolene completely abolished DADs and TA. Black arrows indicate the last two paced action potentials at 1 Hz stimulation.
References
-
- Berridge MJ. Cardiac calcium signalling. Biochem Soc Trans. 2003;31:930–933. - PubMed
-
- Bers DM. Macromolecular complexes regulating cardiac ryanodine receptor function. J Mol Cell Cardiol. 2004;37:417–429. - PubMed
-
- Cheng H, Lederer WJ, Cannell MB. Calcium sparks: elementary events underlying excitation–contraction coupling in heart muscle. Science. 1993;262:740–744. - PubMed
-
- Eisner DA, Kashimura T, Venetucci LA, Trafford AW. From the ryanodine receptor to cardiac arrhythmias. Circ J. 2009;73:1561–1567. - PubMed
Publication types
MeSH terms
Substances
LinkOut - more resources
Full Text Sources
Other Literature Sources
Molecular Biology Databases
Research Materials
Miscellaneous
