. 2012 Mar;190(3):1017-24.
doi: 10.1534/genetics.111.136069. Epub 2011 Dec 14.

Efficient mapping and cloning of mutations in zebrafish by low-coverage whole-genome sequencing

Affiliations

Efficient mapping and cloning of mutations in zebrafish by low-coverage whole-genome sequencing

Margot E Bowen et al. Genetics. 2012 Mar.

Abstract

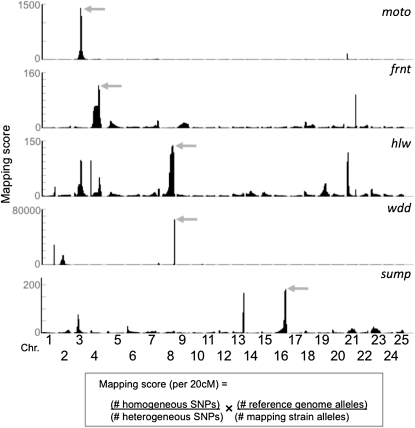
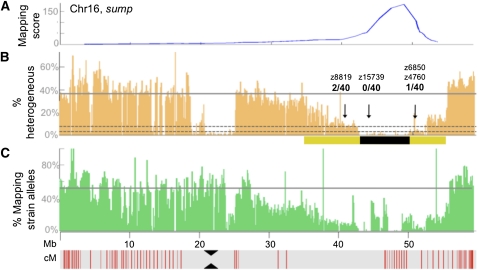
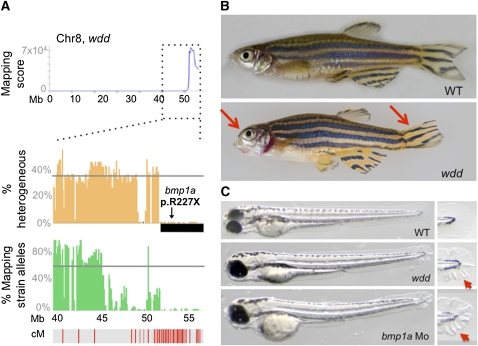
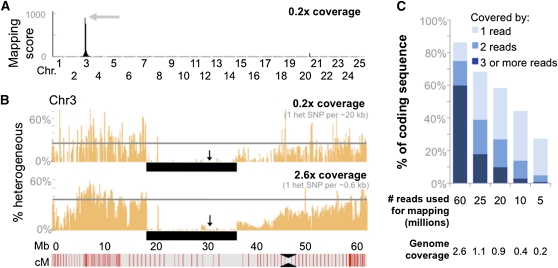
The generation and analysis of mutants in zebrafish has been instrumental in defining the genetic regulation of vertebrate development, physiology, and disease. However, identifying the genetic changes that underlie mutant phenotypes remains a significant bottleneck in the analysis of mutants. Whole-genome sequencing has recently emerged as a fast and efficient approach for identifying mutations in nonvertebrate model organisms. However, this approach has not been applied to zebrafish due to the complicating factors of having a large genome and lack of fully inbred lines. Here we provide a method for efficiently mapping and detecting mutations in zebrafish using these new parallel sequencing technologies. This method utilizes an extensive reference SNP database to define regions of homozygosity-by-descent by low coverage, whole-genome sequencing of pooled DNA from only a limited number of mutant F(2) fish. With this approach we mapped each of the five different zebrafish mutants we sequenced and identified likely causative nonsense mutations in two and candidate mutations in the remainder. Furthermore, we provide evidence that one of the identified mutations, a nonsense mutation in bmp1a, underlies the welded mutant phenotype.


Figures

Figure 1
Figure 1
Mapping zebrafish mutants based on homozygosity-by-descent. Individual graphs depict the mapping scores along each chromosome for the five different mutants (moto, frnt, hlw, wdd, and sump). The mapping score is calculated as the ratio of homogeneous to heterogeneous SNPs, multiplied by the ratio of reference alleles to mapping strain alleles in sliding windows. The size of the sliding windows is 20 cM with an overlap of 19.75 cM between adjacent windows. Physical distances were converted to genetic distances using markers from the MGH meiotic map that have been mapped onto the Zv9 reference genome. In each of the five mutants, the region with the highest mapping score in the genome (shaded arrows) was subsequently confirmed as containing the linked interval, using SSLP or SNP markers.
Figure 2
Figure 2
Genetic architecture of SNP diversity at a linked interval. (A) Graph of the mapping score across chromosome 16 in the sump mutant. This chromosome contained the highest mapping score in the genome. (B) Graph depicting the percentage of SNPs that were classified as heterogeneous in nonoverlapping 100-kb windows along chromosome (Chr)16. The solid gray line indicates the genome-wide average for SNPs classified as heterogeneous. Dotted gray lines indicate reductions in SNP heterogeneity of 90% (bottom line) and 81% (top line), respectively, compared to the genome-wide average. The yellow bar demarcates the region with a reduction in heterogeneity of at least 30%, while the black bar demarcates the candidate region, defined by a reduction in heterogeneity of >90%. Black arrows indicate the locations of SSLP markers used to confirm linkage to this interval by individually genotyping the 20 sump mutants that had been pooled for WGS. The fraction of recombination events per 40 meioses for each SSLP marker is indicated. (C) Graph showing the percentage of sites containing mapping-strain alleles, in nonoverlapping 100-kb windows along the chromosome. This percentage is calculated only for sites at which the strain used for mapping (WIK) showed an allele that was not observed in the strain used for mutagenesis (Tü). The gray line indicates the genome-wide average of the percentage of sites containing mapping-strain alleles. Physical distances in megabases along Chr16 are indicated. The red vertical lines in the gray bar below the graphs indicate genetic distances, with lines spaced at ∼1-cM intervals. The position of the centromere is indicated by black triangles.
Figure 3
Figure 3
Identification of a loss-of-function allele of Bmp1a that underlies the wdd mutant phenotype. (A) The mapping-score plot for wdd is shown for Chr8, which contained the highest mapping score in the genome. In the graphs below, the genetic architecture of the linked region is shown. Annotation is similar to Figure 2. The location of the nonsense mutation within bmp1a that lies in the candidate interval is indicated (arrow). (B) Lateral view of adult wild-type and homozygous wdd mutant fish. Mutant fish are characterized by frontonasal shortening of the skull and deformed tailfins (red arrows). (C) Lateral view of wild-type, wdd mutant, and bmp1a morpholino-injected larvae. Mutant and morphant larvae show a similar characteristic wavy appearance of their fin folds (red arrowheads) at 3 dpf, which is not observed in wild-type larvae. Insets show a higher magnification of the distal part of the finfold.
Figure 4
Figure 4
Mapping of mutants using only ∼0.2× genome coverage. (A) Graph depicting the genome-wide mapping score plot for the moto mutant generated with a randomly selected subset (5 million) of the total sequencing reads, which results in a genome coverage of 0.2×. (B) Graph depicting the percentage of SNPs that were classified as heterogeneous in nonoverlapping 100-kb windows along Chr3. The arrow indicates the location of a SNP marker that was used to confirm linkage (0 recombinants in 40 meioses). While the overall number of detectable heterogeneous SNPs is reduced with a genome-wide coverage of only 0.2×, the boundaries of the linked interval can be identified just as well as with 2.6× coverage. The black bar underlies the region of homogeneity. (C) Graph depicting the loss in coverage of coding sequence that occurs as genome-wide coverage decreases.

References

    1. Arnold C. N., Xia Y., Lin P., Ross C., Schwander M., et al. , 2011. Rapid identification of a disease allele in mouse through whole genome sequencing and bulk segregation analysis. Genetics 187: 633–641 - PMC - PubMed
    1. Austin, R. S., D. Vidaurre, G. Stamatiou, R. Breit, N. J. Provart et al, 2011 Next-generation mapping of Arabidopsis genes. Plant J. 67: 715–725. - PubMed
    1. Bowen M. E., Boyden E. D., Holm I. A., Campos-Xavier B., Bonafe L., et al. , 2011. Loss-of-function mutations in PTPN11 cause metachondromatosis, but not ollier disease or maffucci syndrome. PLoS Genet. 7: e1002050. - PMC - PubMed
    1. Bradley K. M., Elmore J. B., Breyer J. P., Yaspan B. L., Jessen J. R., et al. , 2007. A major zebrafish polymorphism resource for genetic mapping. Genome Biol. 8: R55. - PMC - PubMed
    1. Coe T. S., Hamilton P. B., Griffiths A. M., Hodgson D. J., Wahab M. A., et al. , 2009. Genetic variation in strains of zebrafish (danio rerio) and the implications for ecotoxicology studies. Ecotoxicology 18: 144–150 - PubMed

Publication types

LinkOut - more resources