. 2012 Jan 6;335(6064):100-4.
doi: 10.1126/science.1216166. Epub 2011 Dec 15.

Asymmetry and aging of mycobacterial cells lead to variable growth and antibiotic susceptibility

Affiliations

Asymmetry and aging of mycobacterial cells lead to variable growth and antibiotic susceptibility

Bree B Aldridge et al. Science. .

Abstract

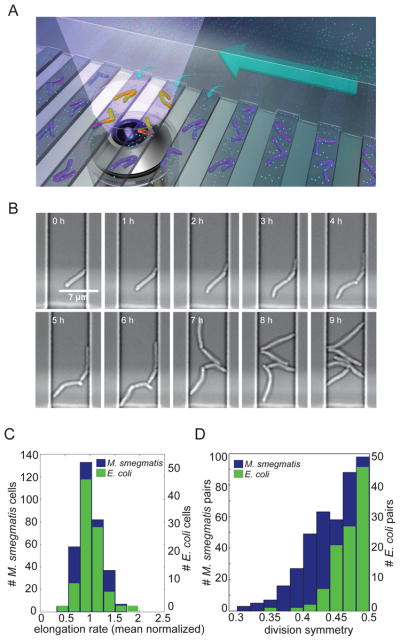
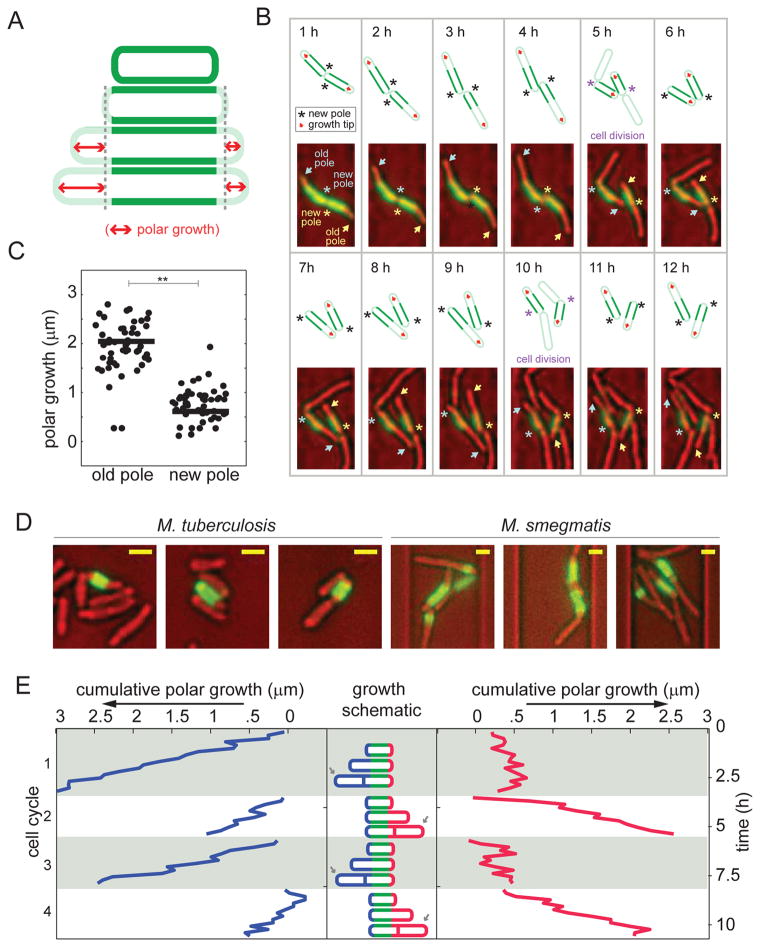
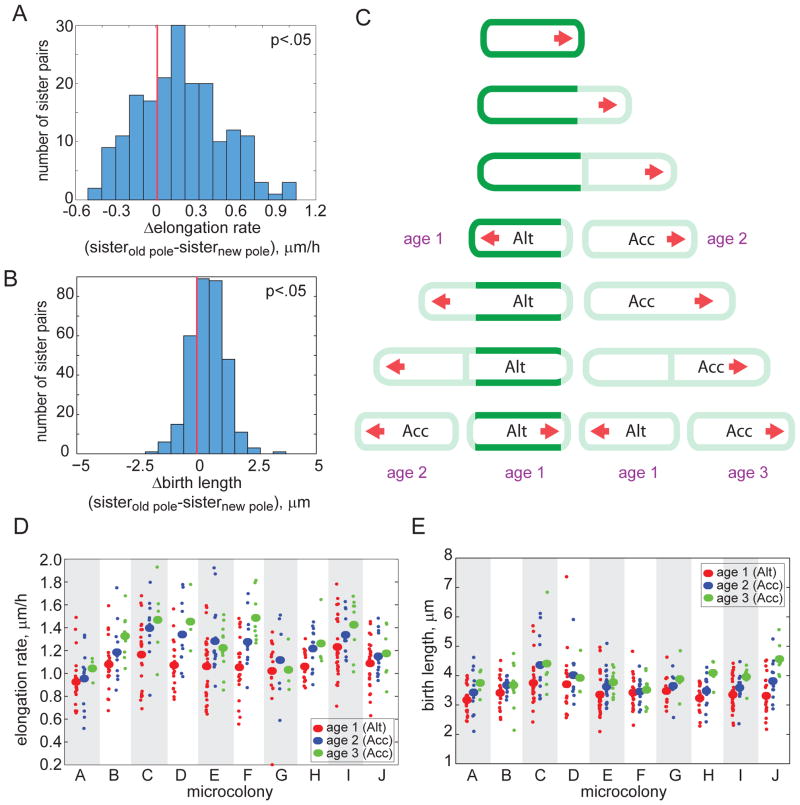
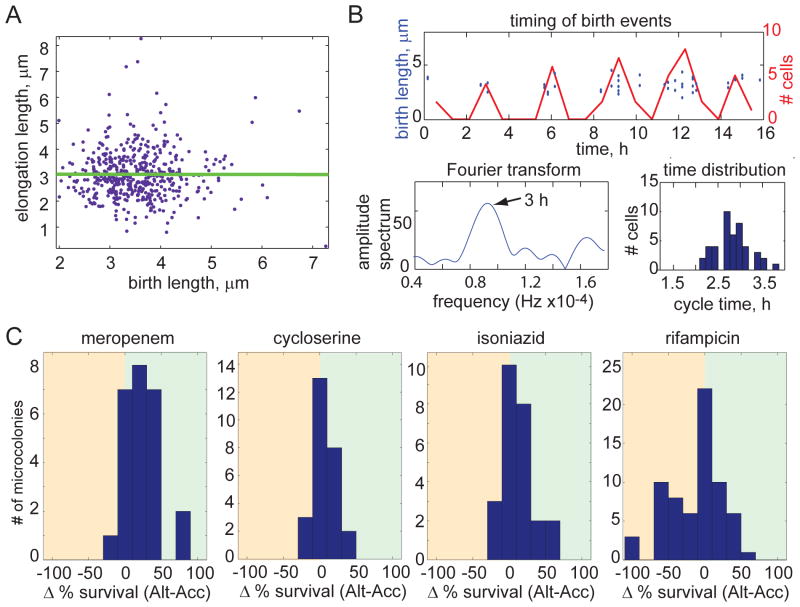
Cells use both deterministic and stochastic mechanisms to generate cell-to-cell heterogeneity, which enables the population to better withstand environmental stress. Here we show that, within a clonal population of mycobacteria, there is deterministic heterogeneity in elongation rate that arises because mycobacteria grow in an unusual, unipolar fashion. Division of the asymmetrically growing mother cell gives rise to daughter cells that differ in elongation rate and size. Because the mycobacterial cell division cycle is governed by time, not cell size, rapidly elongating cells do not divide more frequently than slowly elongating cells. The physiologically distinct subpopulations of cells that arise through asymmetric growth and division are differentially susceptible to clinically important classes of antibiotics.


Figures

Figure 1
Figure 1. M. smegmatis exhibits heterogeneous growth characteristics
(A) Schematic diagram of the microfluidic device used for long-term imaging of mycobacteria. Media flows through the main channel (large arrow) and provides nutrients (cyan circles) by diffusion (small arrows) to the cells. (B) Bright-field, time-lapse imaging of M. smegmatis in the microfluidic device.. (C) Distribution of average (mean centered) elongation rates of 322 individual M. smegmatis (blue; left axis) and 102 E. coli (green; right axis) cells averaged over the course of one cell cycle. The mean elongation rates were 1.15 μm/h for M. smegmatis and 3.72 μm/h for E. coli. (D) Distribution of division symmetry for 166 M. smegmatis (blue; left axis) and 105 E. coli (green; right axis) pairs of sister cells. Division symmetry is calculated as the ratio of the length of the smaller sister to the sum of the lengths of both sisters at division.
Figure 2
Figure 2. M. smegmatis growth is asymmetric and elongation occurs from the old pole
(A) Schematic diagram of the pulse-chase experiment used to measure polar growth. Cells were labeled with amine reactive dye (green) and growth was assessed by measuring the extension of the unlabeled region (red arrows). Cell wall-labeling did not alter cell elongation rate (fig. S5A), other labeling chemistries such as hydroxylamine labeling via periodate oxidation led to similar staining patterns (data not shown), and similar labeling patterns were seen in cells grown in broth and in microfluidic channels (fig. S5B). (B) Time-lapse imaging of two sister cells following the pulse-labeling (green) of the cell wall. The bright field images were pseudo-colored red. New poles are annotated with asterisks and the old poles with arrows. Each cell’s poles are annotated with the same color asterisk and arrow. A schematic is drawn above each image, marking the new poles and growth poles with an asterisk and red arrow, respectively. We also used a fluorescein-vancomycin conjugate (Van-FL) to stain nascent peptidoglycan (30) and found preferential labeling of the old pole over the new pole (fig. S5C). (C) Growth over one cell cycle at new versus old poles in 50 cells (*p<0.001 by a Mann-Whitney rank sum test). There was no cell in which the new pole elongated more than the old pole. (D) Three representative images of M. tuberculosis (left) and M. smegmatis (right) following the pulse-labeling (green) of the cell wall (after 48 hours in broth culture for M. tuberculosis and six hours in the microfluidic device for M. smegmatis). The bright field images are pseudo-colored red. Size bars represent 1.3 μm. Comparison images of E. coli labeled under similar conditions may be found in fig. S5D. (E) Cumulative polar growth for one labeled cell plotted for each pole through four cell cycles. The cell inheriting the new pole alternates the direction of growth after division events.
Figure 3
Figure 3. Division creates sister cells with different growth properties
(A–B) Distribution of the differences in elongation rate (A) and birth length (B) between sister cells inheriting the old pole and the new pole. The distributions are skewed (p<0.05; red lines denote zero), indicating that the sister inheriting the older pole elongates faster (in 71% of the 161 sister pairs) and is larger at division (in 74% of the 161 sister pairs). In 7.5% of the 161 sister pairs, the sister that inherited the new pole elongated faster and was longer at birth than its sister. (C) Schematic model for mycobacterial growth. A labeled cell (green) is shown to elongate from one pole (red arrow). Two sister cells are created at division: an accelerator (Acc) cell inheriting the old (growing) pole and an alternator (Alt) cell inheriting the new pole. Growth pole age (in generations) is labeled in purple. (D–E) Elongation rate (D) and birth lengths (E) are plotted for ten microcolonies, with cell subpopulations grouped by growth pole age. Growth pole age was scored by mapping the pedigrees of unlabeled cells through several generations via live cell imaging. Subpopulation means (large ovals) are plotted along with data from individual cells (small circles). Elongation rate and birth length increase within a colony as the growth poles age (p<0.05 for alternator vs. accelerator elongation rates; and p<0.05 for alternator vs. accelerator and age two vs. age three birth lengths).
Figure 4
Figure 4. Population heterogeneity of growth characteristics is maintained by time-based cell division cycle regulation and contributes to differential susceptibility to antibiotic stress
(A) Birth length and elongation length, which is defined as the length that the cell elongates between birth and division, are uncorrelated for 322 M. smegmatis cells (regression slope of 0.00), suggesting that mycobacteria use time to regulate their cell cycle. (B) Cell cycle timing is characterized for one microcolony (a second representative microcolony is shown in fig. S3B). Division events are plotted in the time domain as discrete events (blue circles; left axis) and as a histogram (red line; right axis). The histogram of birth events was used to generate an amplitude spectrum with a Fourier transform, shown in the lower left plot. The peak represents the cycle time of the microcolony (arrow). The spread of cycle times for individual cells is shown here as histogram in the lower right. (C) Distributions of the difference in bacterial survival between accelerator and alternator cells for each microcolony following treatment with meropenem, cycloserine, isoniazid, and rifampicin at minimal inhibitory concentrations (2.3 mM, 0.04 mg/ml, 25 μM, and 50 μM, respectively; p<0.05 for each distribution). Survival was scored by determining the percentage of cells that were able to regrow after antibiotic was removed. The analysis includes 317 cells in 25 microcolonies for meropenem, 374 cells in 26 microcolonies for cycloserine, 334 cells in 25 microcolonies for isoniazid, and 453 cells in 66 microcolonies for rifampicin.

Comment in

References

    1. Cohn DL, Catlin BJ, Peterson KL, Judson FN, Sbarbaro JA. A 62-dose, 6-month therapy for pulmonary and extrapulmonary tuberculosis. A twice-weekly, directly observed, and cost-effective regimen. Ann Intern Med. 1990;112:407–415. - PubMed
    1. Elzinga G, Raviglione MC, Maher D. Scale up: meeting targets in global tuberculosis control. Lancet. 2004;363:814–819. - PubMed
    1. McCune RM, Feldmann FM, Lambert HP, McDermott W. Microbial persistence. I. The capacity of tubercle bacilli to survive sterilization in mouse tissues. J Exp Med. 1966;123:445–468. - PMC - PubMed
    1. Connolly LE, Edelstein PH, Ramakrishnan L. Why Is Long-Term Therapy Required to Cure Tuberculosis? PLoS Med. 2007;4:e120. - PMC - PubMed
    1. Materials and methods are available as supporting material on Science online.

Publication types

MeSH terms