Case Reports
. 2012 Apr 12;119(15):3458-68.
doi: 10.1182/blood-2011-09-378364. Epub 2011 Dec 14.

MST1 mutations in autosomal recessive primary immunodeficiency characterized by defective naive T-cell survival

Affiliations
Case Reports

MST1 mutations in autosomal recessive primary immunodeficiency characterized by defective naive T-cell survival

Nadine T Nehme et al. Blood. .

Abstract

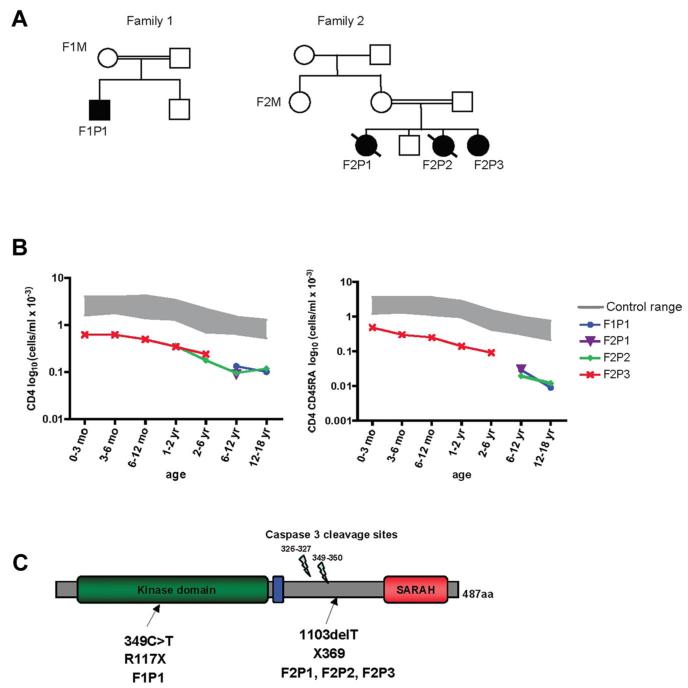
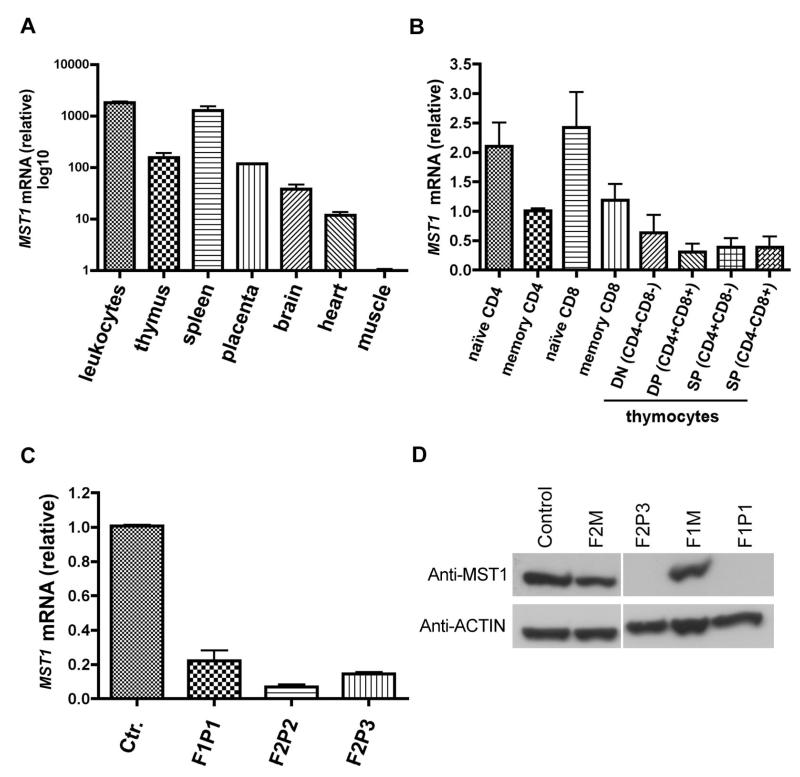
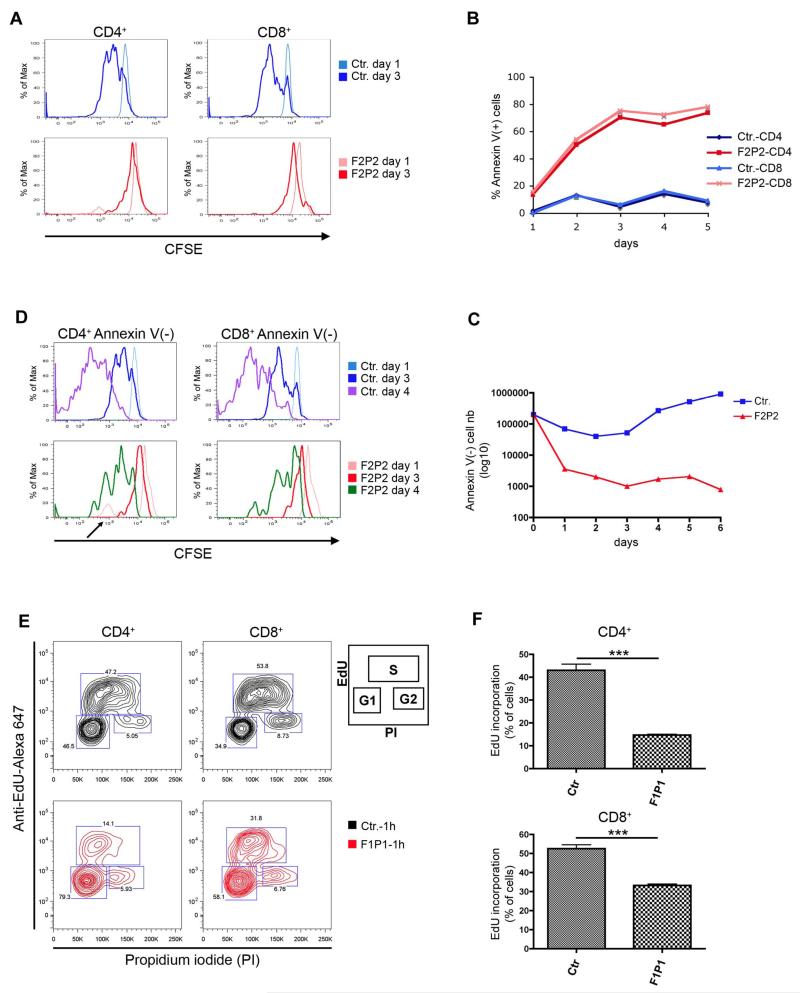
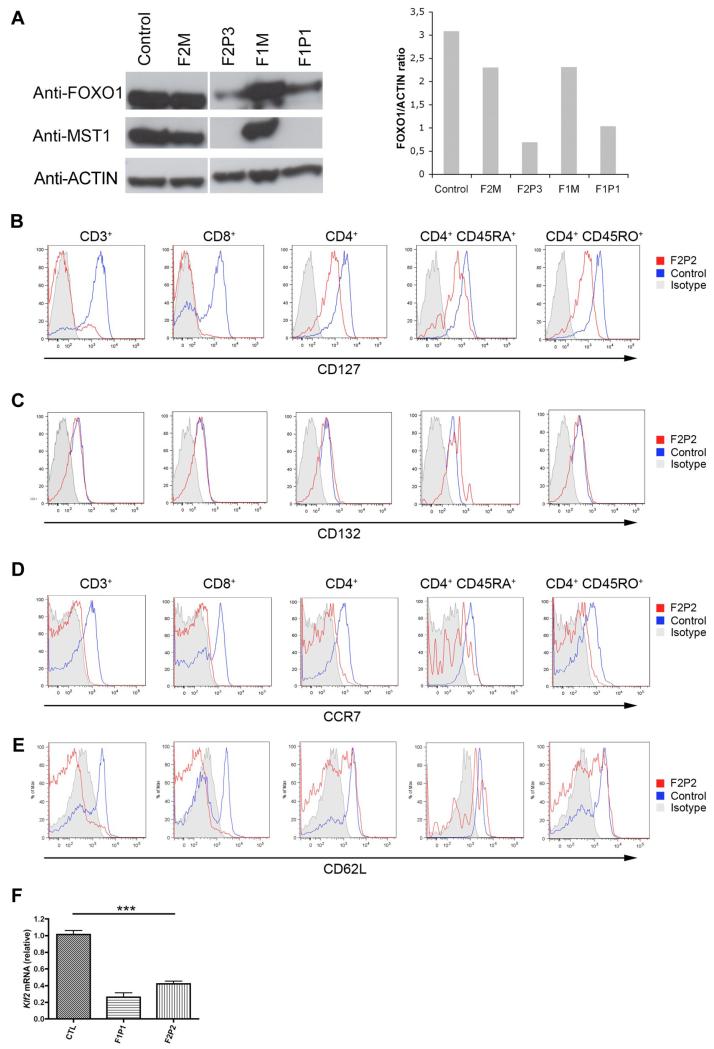
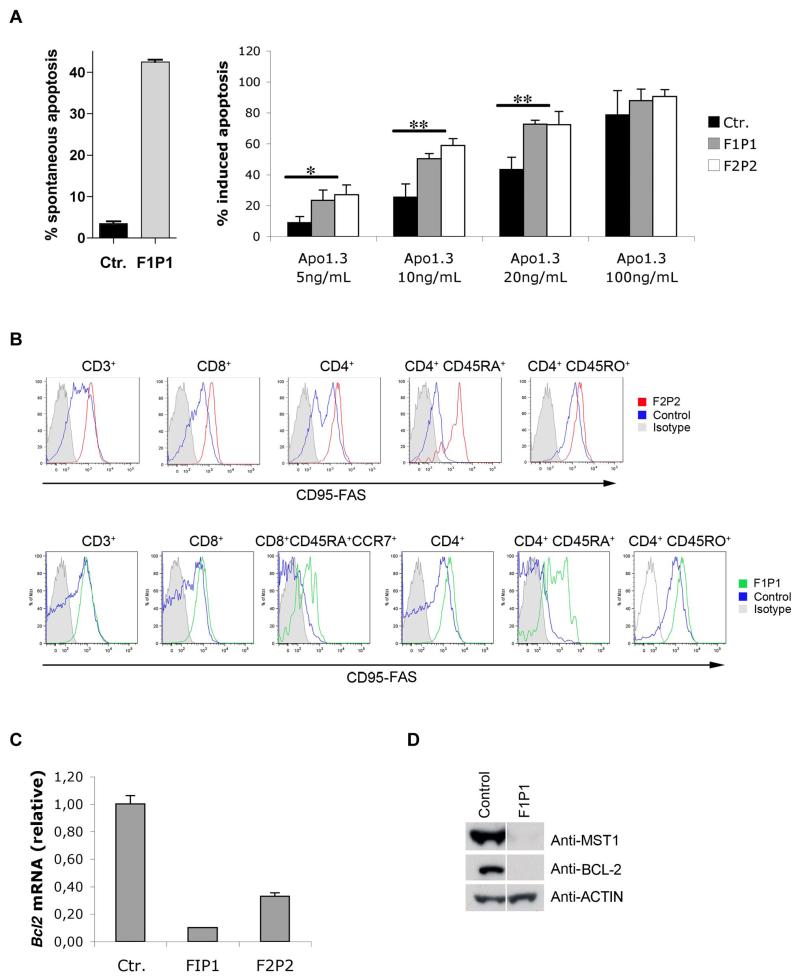
The molecular mechanisms that underlie T-cell quiescence are poorly understood. In the present study, we report a primary immunodeficiency phenotype associated with MST1 deficiency and primarily characterized by a progressive loss of naive T cells. The in vivo consequences include recurrent bacterial and viral infections and autoimmune manifestations. MST1-deficient T cells poorly expressed the transcription factor FOXO1, the IL-7 receptor, and BCL2. Conversely, FAS expression and the FAS-mediating apoptotic pathway were up-regulated. These abnormalities suggest that increased cell death of naive and proliferating T cells is the main mechanism underlying this novel immunodeficiency. Our results characterize a new mechanism in primary T-cell immunodeficiencies and highlight a role of the MST1/FOXO1 pathway in controlling the death of human naive T cells.


Figures

Figure 1
Figure 1. MST1 mutations in 2 families
(A) Pedigrees of 2 families presenting a CID syndrome. Consanguinity is indicated by double horizontal bars. Black boxes and circles represent affected males and females, respectively. Diagonal bar indicates deceased subjects. An identification number was assigned to each patient. (B) Semilogarithmic graph representing the progressive CD4 T-cell lymphopenia (left) and the marked loss over time of naive CD4 CD45RA+ T cells (right) observed in MST1-deficient patients. (C) Schematic representation of the MST1 protein. Mutations identified in the families are indicated by arrows.
Figure 2
Figure 2. MST1 expression
(A) MST1 transcript levels were quantified as the -fold difference of mRNA levels for MST1 normalized against the housekeeping gene ACTA1 (β-actin). Data are representative of 2 independent experiments performed in duplicate. (B) MST1 transcript levels were quantified as the -fold difference in mRNA levels for MST1 (normalized to ACTA1) in control sorted naive (CD4+ CD45RA+; CD8+ CD45RA+ CCR7+) and memory subpopulations of CD4 (CD4+ CD45RO+) and CD8 (CD8+ CD45RO+ CCR7) T cells, as well as double-negative, double-positive, and single-positive thymocytes. Data are representative of 3 independent experiments performed in duplicate. (C) MST1 transcript levels in control and patient T cells. Data are representative of 5 independent experiments performed in duplicate. (D) A Western blot analysis of MST1 protein expression in lymphocytes from a healthy control, 2 heterozygous individuals (F2M, F1M), and 2 MST1-deficient patients with different homozygous nonsense mutations. Actin was used as the loading control. Data are representative of 5 independent experiments.
Figure 3
Figure 3. Impaired proliferation and survival of MST1-deficient T cells in response to activation signals
(A) Control (Ctr.) and MST1-deficient (F2P2) CD4 and CD8 T cells were analyzed in terms of the rate of division (with CFSE dilution indicating cell proliferation) every 24 hours from day 1-3 after PMA/ionomycin–induced activation. Data are representative of 4 independent experiments. (B) Cell death, as analyzed by annexin V binding to control (Ctr.) and MST1-deficient (F2P2) CD4 and CD8 T cells, at different time points (every 24 hours) after CFSE labeling and PMA/ionomycin activation. Data are representative of 2 independent experiments. (C) Absolute cell counts for annexin V+ T cells in the CFSE+ population presented in panel B. Data are representative of 3 independent experiments. (D) CFSE and annexin V staining of PMA/ionomycin-activated control (Ctr.) and MST1-deficient (F2P2) CD4 and CD8 T cells. Cells were stained with annexin V and sized at different time points by flow cytometry. Histograms depict the CFSE dilution of viable CD4 and CD8 T cells (annexin V). It is important to note that the CFSE graphs are normalized against the number of cells; the histograms represent thepercentage of the maximum signal (% of Max) and do not reflect the number of dividing cells. Data are representative of 2 independent experiments. (E) Cell proliferation, as measured by EdU incorporation in control (Ctr.) and MST1-deficient (F1P1) CD4 and CD8 T cells after 8 days of culture. Cells were labeled with EdU for 60 minutes before fixation. The EdU intensity is shown on the logarithmic y-axis and DNA content (propidium iodide staining) is shown on the linear x-axis. Gates defined the percentage of cells in the G1, S (EdU positive), and G2 phases, as presented in the inset. Data are representative of 3 independent experiments. (F) Quantification of EdU incorporation by CD4 and CD8 obtained from control (Ctr.) and MST1-deficient patients (F1P1). Data are representative of 3 independent experiments and are shown as means ± SEM. ***P < .001.
Figure 4
Figure 4. Down-regulation of FOXO1, IL-7Rα, CCR7, and CD62L expression in MST1-deficient T cells
(A) Left: Western blot showing FOXO1 and MST1 protein level in whole-lymphocyte lysates from a healthy control, 2 heterozygous patients (patients F2M and F1M), and 2 MST1-deficient patients with different homozygous nonsense mutations (patients F1P1 and F2P3). Actin served as a loading control. Right: Abundance of FOXO1 relative to actin (signal intensity measurement). Results are presented as the FOXO1/actin ratio (in arbitrary units). Data are representative of 3 independent experiments. (B-C) IL-7Rα (CD127) and common cytokine receptor γ-chain (CD132) expression on CD3, CD8, CD4, CD4 CD45RA+, and CD4 CD45RO+ T cells from a control and an MST1-deficient patient (F2P2). Similar results were obtained for cells from F1P1. One of 6 experiments with similar results is shown (4 independent experiments for F2P2 and 2 for F1P1). (D-E) CCR7 and CD62L expression by freshly isolated control and MST1-deficient (F2P2) PBMCs. One of 6 experiments with similar results is shown (4 independent experiments for F2P2 and 2 for F1P1). (F) Quantitative PCR analysis of KLF2 mRNA expression. KLF2 transcript levels were quantified as the -fold difference normalized against ACTA1 (β-actin) mRNA levels in control (Ctr.) and MST1-deficient (F1P1 and F2P2) PBMCs.
Figure 5
Figure 5. Greater expression of FAS is correlated with greater sensitivity to FAS-induced apoptosis and down-regulation of BCL2 expression in MST1-deficient T cells
(A) Spontaneous apoptosis (left) and death-receptor-induced apoptosis (right) in vitro was assessed on PMA/ionomycin-activated T cells from control (Ctr.) and MST1-deficient patients (patients F1P1 and F2P2). After 8 days of activation, blasts were incubated overnight in the absence or presence of a dose gradient of anti-FAS Ab (Apo1.3). The percentage of apoptotic cells (means ± SEM of 3 independent experiments) was then measured by propidium iodide labeling of DNA fragmentation. *P < .05; **P < .01. (B) FAS expression on PBMCs freshly isolated from control (Ctr.) and MST1-deficient patients (patients F1P1 and F2P2). FAS expression was monitored in a freshly isolated T-cell subpopulation. One of 6 experiments with similar results is shown. (C) Quantitative PCR analysis of BCL2 mRNA expression normalized against ACTA1 (β-actin) mRNA in total PBMCs freshly isolated from control (Ctr.) and MST1-deficient patients (patients F1P1 and F2P2). Data represent the means of 4 independent experiments. (D) Western blot showing BCL2 and MST1 protein levels in whole lymphocytes lysates from a healthy individual and an MST1-deficient patient (patient F1P1). Actin served as the loading control.

Comment in

  • A loss of naivete.
    Risma K. Risma K. Blood. 2012 Apr 12;119(15):3371-2. doi: 10.1182/blood-2012-02-410399. Blood. 2012. PMID: 22500047

References

    1. Fischer A. Human primary immunodeficiency diseases. Immunity. 2007;27(6):835–845. - PubMed
    1. International Union of Immunological Societies Expert Committee on Primary Immunodeficiencies. Notarangelo LD, Fischer A, Geha RS, et al. Primary immunodeficiencies: 2009 update. J Allergy Clin Immunol. 2009;124(6):1161–1178. - PMC - PubMed
    1. Chinen J, Shearer WT. Advances in basic and clinical immunology in 2010. J Allergy Clin Immunol. 2011;127(2):336–341. - PMC - PubMed
    1. Schuetz C, Niehues T, Friedrich W, Schwarz K. Autoimmunity, autoinflammation and lymphoma in combined immunodeficiency (CID) Autoimmun Rev. 2010;9(7):477–482. - PubMed
    1. Zhang Q, Davis JC, Lamborn IT, et al. Combined immunodeficiency associated with DOCK8 mutations. N Engl J Med. 2009;361(21):2046–2055. - PMC - PubMed

Publication types

Substances