. 2011 Dec 16;334(6062):1518-24.
doi: 10.1126/science.1205438.

Detecting novel associations in large data sets

Affiliations

Detecting novel associations in large data sets

David N Reshef et al. Science. .

Abstract

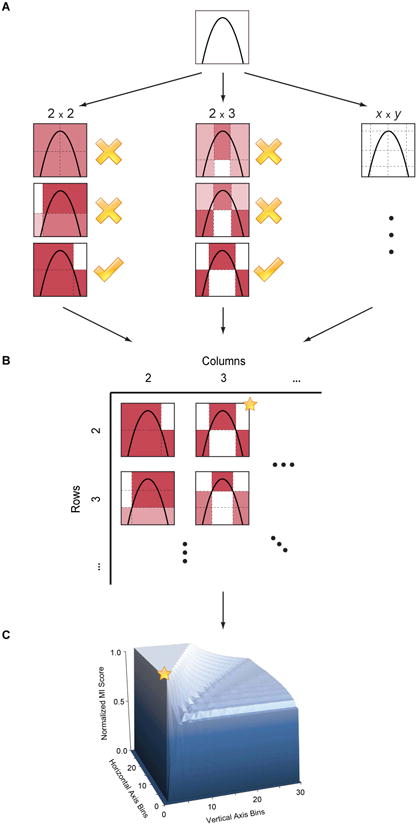
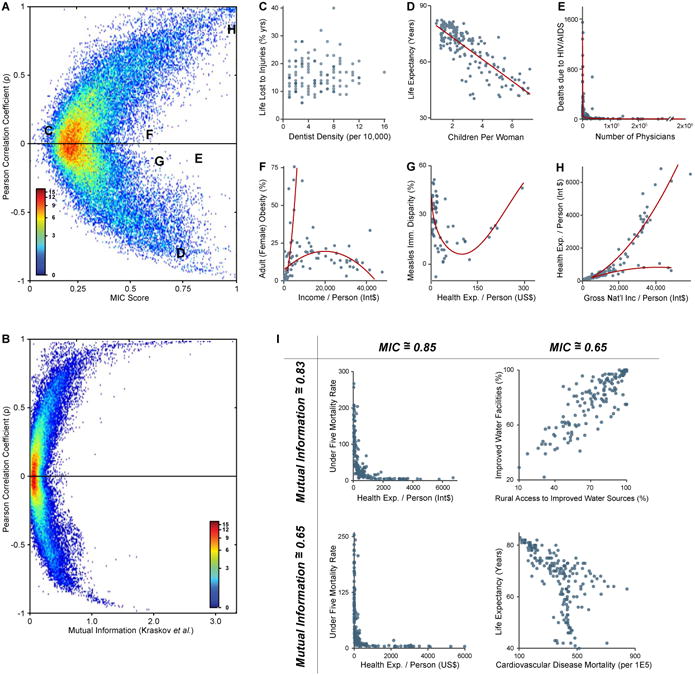
Identifying interesting relationships between pairs of variables in large data sets is increasingly important. Here, we present a measure of dependence for two-variable relationships: the maximal information coefficient (MIC). MIC captures a wide range of associations both functional and not, and for functional relationships provides a score that roughly equals the coefficient of determination (R(2)) of the data relative to the regression function. MIC belongs to a larger class of maximal information-based nonparametric exploration (MINE) statistics for identifying and classifying relationships. We apply MIC and MINE to data sets in global health, gene expression, major-league baseball, and the human gut microbiota and identify known and novel relationships.


Figures

Figure 1
Figure 1. Computing MIC
(A) For each pair (x,y), the MIC algorithm finds the x-by-y grid with the highest induced mutual information. (B) The algorithm normalizes the mutual information scores and compiles a matrix that stores, for each resolution, the best grid at that resolution and its normalized score. (C) The normalized scores form the characteristic matrix, which can be visualized as a surface; MIC corresponds to the highest point on this surface. In this example, there are many grids that achieve the highest score. The star in (B) marks a sample grid achieving this score, and the star in (C) marks that grid's corresponding location on the surface.
Figure 2
Figure 2. Comparison of MIC to Existing Methods
(A) Scores given to various noiseless functional relationships by several different statistics (8, 12, 14, 19). Maximal scores in each column are accentuated. (B-F) The MIC, Spearman correlation coefficient, mutual information (Kraskov et al. estimator), maximal correlation (via ACE), and the principal curve-based CorGC dependence measure, respectively, of 27 different functional relationships with independent uniform vertical noise added, as the R2 value of the data relative to the noiseless function varies. Each shape/color corresponds to a different combination of function type and sample size. In each plot, pairs of thumbnails show relationships that received identical scores; for data exploration, we would like these pairs to have similar noise levels. For a list of the functions and sample sizes in these graphs as well as versions with other statistics, sample sizes, and noise models, see Figs. S3 and S4. (G) Performance of MIC on associations not well modeled by a function, as noise level varies. For the performance of other statistics, see Figs. S5 and S6.
Figure 3
Figure 3. Visualizations of the Characteristic Matrices of Common Relationships
(A-F) Surfaces representing the characteristic matrices of several common relationship types. For each surface, the x-axis represents number of vertical axis bins (rows), the y-axis represents number of horizontal axis bins (columns), and the z-axis represents the normalized score of the best-performing grid with those dimensions. The inset plots show the relationships used to generate each surface. For surfaces of additional relationships see Fig. S7.
Figure 4
Figure 4. Application of MINE to Global Indicators from the World Health Organization
(A) MIC versus ρ for all pairwise relationships in the WHO dataset. (B) Mutual information (Kraskov et al. estimator) versus ρ for the same relationships. High mutual information scores tend to be assigned only to relationships with high ρ, while MIC gives high scores also to relationships that are non-linear. (C-H) Example relationships from (A). (C) Both ρ and MIC yield low scores for uncorrelated variables. (D) Ordinary linear relationships score high under both tests. (E-G) Relationships detected by MIC but not by ρ, because the relationships are non-linear (E,G) or because more than one relationship is present (F). In (F), the linear trendline comprises a set of Pacific island nations in which obesity is culturally valued (33); most other countries follow a parabolic trend (Table S10). (H) A superposition of two relationships that scores high under all three tests, presumably because the majority of points obey one relationship. The less steep minority trend consists of thirteen countries whose economies rely largely on oil (37) (Table S11). The lines of best fit in (D-H) were generated using polynomial regression on each trend. (I) Of these four relationships, the left two appear less noisy than the right two. MIC accordingly assigns higher scores to the two relationships on the left. In contrast, mutual information assigns similar scores to the top two relationships and similar scores to the bottom two relationships.
Figure 5
Figure 5. Application of MINE to S cerivisiae Gene Expression Data
(A) MIC versus scores obtained by Spellman et al. for all genes considered (26). Genes with high Spellman scores tend to receive high MIC scores, but some genes undetected by Spellman's analysis also received high MICs. (B) MAS versus Spellman's statistic for genes with significant MICs. Genes with a high Spellman score also tend to have a high MAS score. (C-G) Examples of genes with high MIC and varying MAS (trend-lines are moving averages). MAS sorts the MIC-identified genes by frequency. A higher MAS signifies a shorter wavelength for periodic data, indicating that the genes found by Spellman et al. are those with shorter wavelengths. None of the examples except for (F) and (G) were detected by Spellman's analysis. However, subsequent studies have shown that (C-E) are periodic genes with longer wavelengths (22, 24). More plots of genes detected using MIC and MAS are given in Fig. S11.
Figure 6
Figure 6. Associations Between Bacterial Species in the Gut Microbiota of ‘Humanized’ Mice
(A) A non-coexistence relationship explained by diet: under the LF/PP diet a Bacteroidaceae species-level OTU dominates while under a Western diet an Erysipelotrichaceae species dominates. (B) A non-coexistence relationship occurring only in males. (C) A non-linear relationship partially explained by donor. (D) A non-coexistence relationship not explained by diet. (E) A spring graph (see SOM, Section 4.9) in which nodes correspond to OTUs and edges correspond to the top 300 non-linear relationships. Node size is proportional to the number of these relationships involving the OTU, black edges represent relationships explained by diet, and node glow color is proportional to the fraction of adjacent edges that are black (100% is red, 0% is blue).

Comment in

References

    1. Hastie T, Tibshirani R, Friedman JH. The elements of statistical learning: data mining, inference, and prediction. Springer Verlag; 2009.
    1. Science Staff, Challenges and opportunities. Science. 2011;331:693. - PubMed
    1. By ‘functional relationship’ we mean a distribution (X,Y) in which Y is a function of X, potentially with independent noise added.

    1. Caspi A, et al. Influence of life stress on depression: moderation by a polymorphism in the 5-HTT gene. Science. 2003;301:386. - PubMed
    1. Clayton RN, Mayeda TK. Oxygen isotope studies of achondrites. Geochimica et Cosmochimica Acta. 1996;60:1999.

Publication types