. 2012 Feb 15;72(4):876-86.
doi: 10.1158/0008-5472.CAN-11-1792. Epub 2011 Dec 15.

Monocytic CCR2(+) myeloid-derived suppressor cells promote immune escape by limiting activated CD8 T-cell infiltration into the tumor microenvironment

Affiliations

Monocytic CCR2(+) myeloid-derived suppressor cells promote immune escape by limiting activated CD8 T-cell infiltration into the tumor microenvironment

Alexander M Lesokhin et al. Cancer Res. .

Abstract

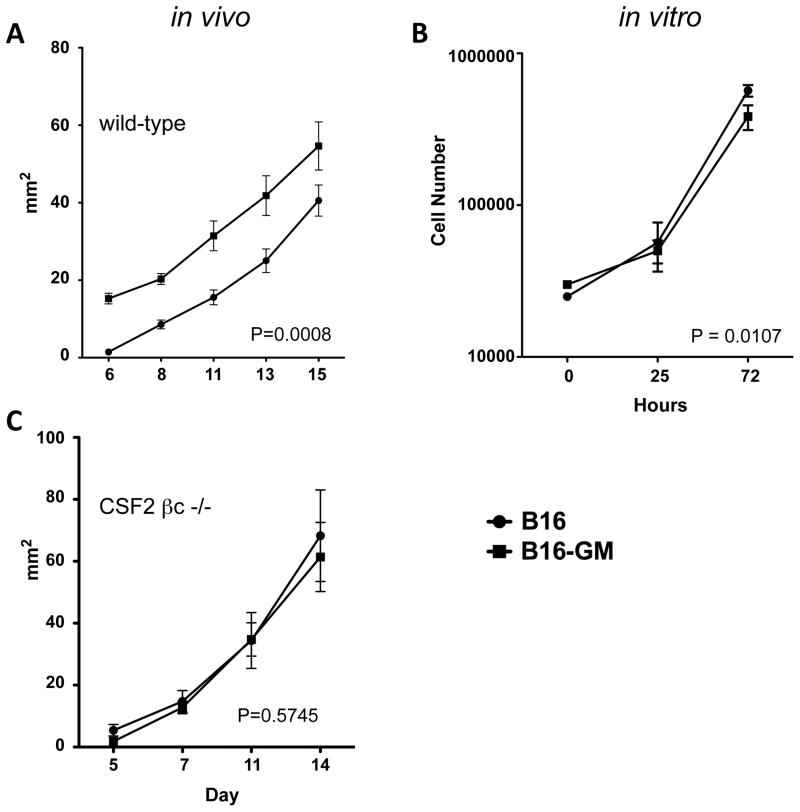
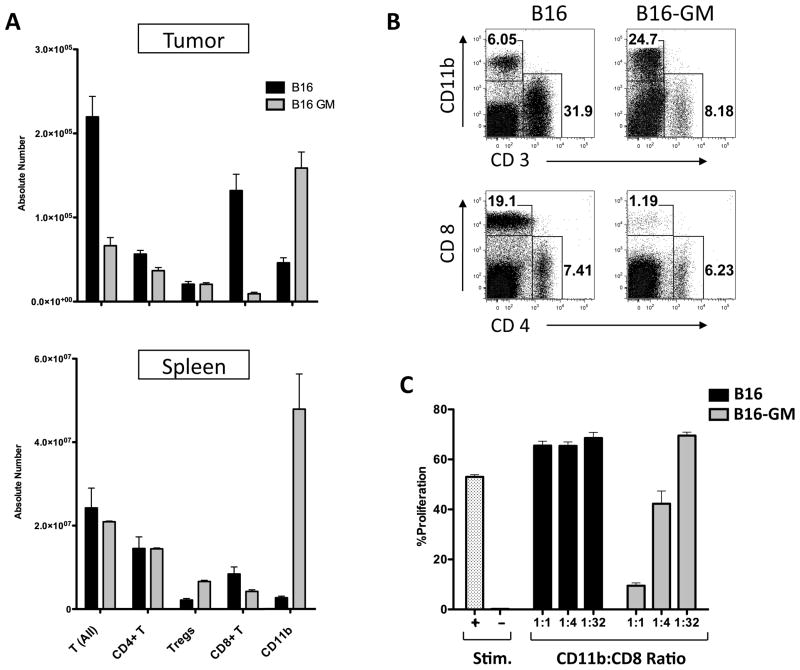
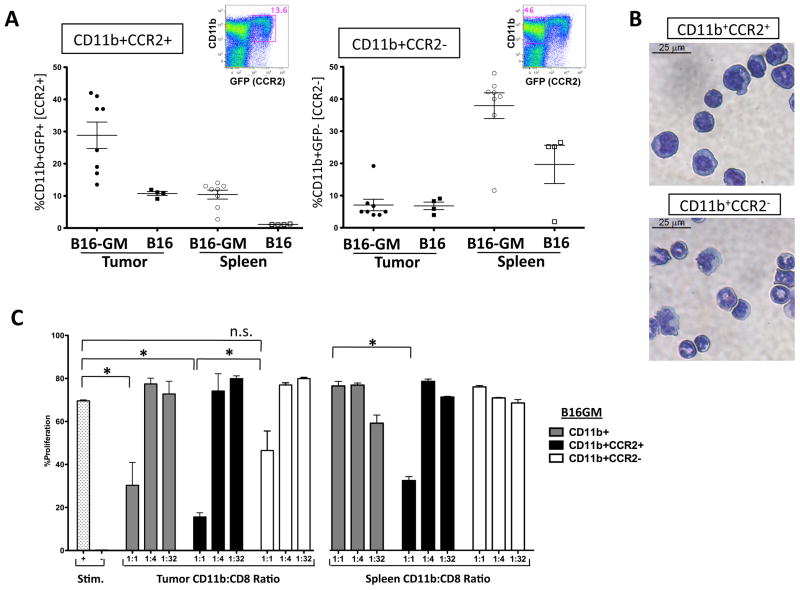
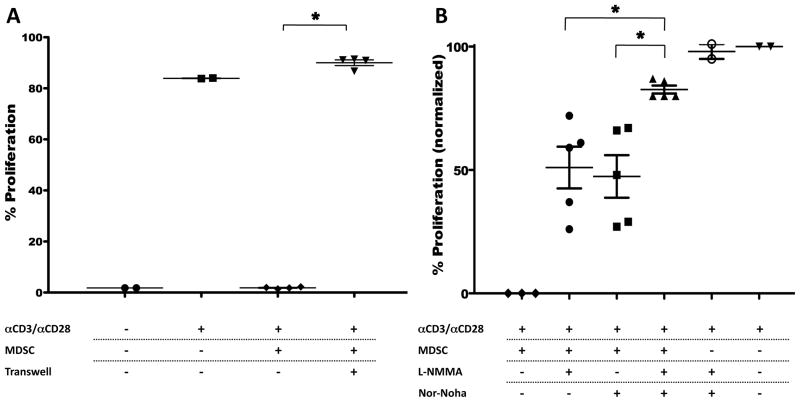
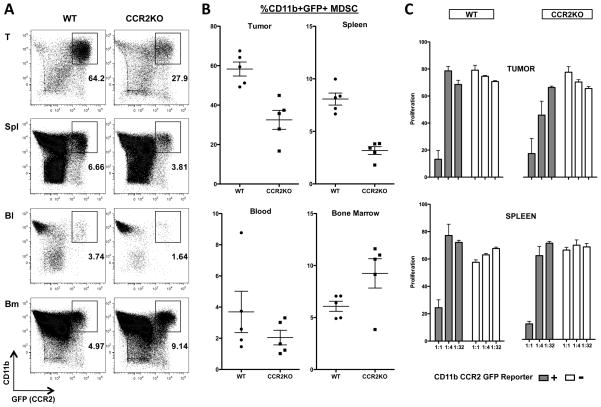
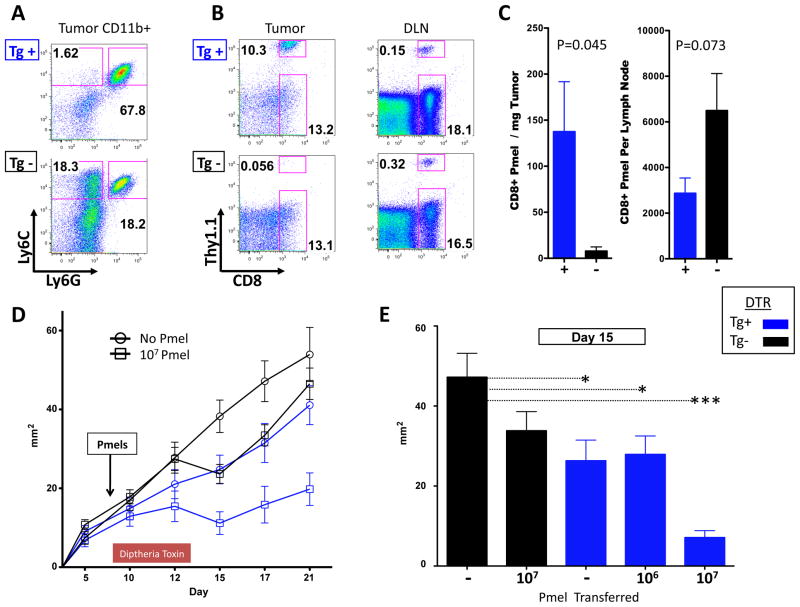
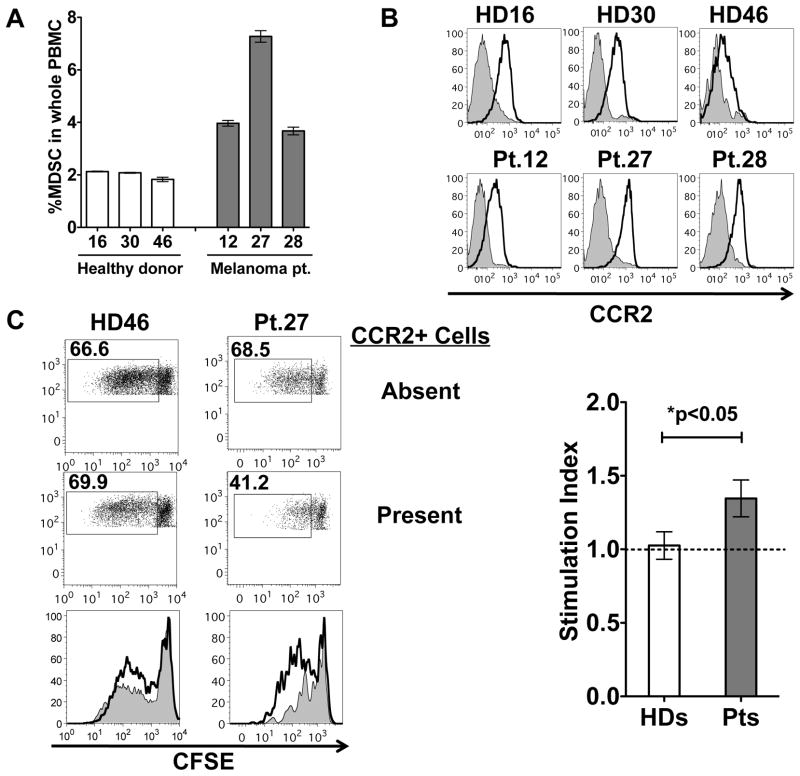
Myeloid-derived suppressor cells (MDSC) are a heterogeneous population of cells that accumulate during tumor formation, facilitate immune escape, and enable tumor progression. MDSCs are important contributors to the development of an immunosuppressive tumor microenvironment that blocks the action of cytotoxic antitumor T effector cells. Heterogeneity in these cells poses a significant barrier to studying the in vivo contributions of individual MDSC subtypes. Herein, we show that granulocyte-macrophage colony stimulating factor, a cytokine critical for the numeric and functional development of MDSC populations, promotes expansion of a monocyte-derived MDSC population characterized by expression of CD11b and the chemokine receptor CCR2. Using a toxin-mediated ablation strategy to target CCR2-expressing cells, we show that these monocytic MDSCs regulate entry of activated CD8 T cells into the tumor site, thereby limiting the efficacy of immunotherapy. Our results argue that therapeutic targeting of monocytic MDSCs would enhance outcomes in immunotherapy.


Conflict of interest statement

The authors have no conflicting interests.

Figures

Figure 1
Figure 1. Chronic GM-CSF promotes tumor growth in vivo
Mice were inoculated intradermally with 1.25×10⁵ B16 or B16-GM tumor cells. Growth was measured in 2 perpendicular dimensions every 2–3 days. Average tumor size is depicted at each timepoint. C57Bl6/J mice (n=10/group) (A); CSF2R βc −/− mice (n=10/group) (C). B16 or B16-GM cells were plated in 6-well plates in triplicate. Cells were harvested and counted at the indicated time interval (B). Representative experiments of 2–3 replicates are shown
Figure 2
Figure 2. Tumor derived GM-CSF recruits an immune inhibitory cellular infiltrate dominated by myeloid derived suppressor cells
C57BL/6 mice were inoculated with 5×10⁵ B16 or B16GM cells in matrigel. Tumors were harvested 13 days later, stained for surface markers and analyzed by flow cytometry. (n=3/tumor type). Results for T cells (CD3+), CD4+ T (CD4+/CD3+), CD8+ T (CD8+/CD3+), Tregs (CD4+/FoxP3+), and CD11b cells (A); Representative plots (B). Suppression assay: CD11b+ cells were flow sorted from B16 or B16-GM tumors as described in the methods and co-cultured with naïve CFSE-labeled CD8+ T cells plated onto α-CD3/α-CD28 coated 96-well plates in the ratios indicated. Stim + are wells without CD11b+ cells and Stim − are wells without MDSC or antibody. %CD8+ T cell proliferation was measured by assessing CFSE dilution by flow cytometry after 72 hours of culture (C). Representative examples of 2–3 replicate experiments are shown.
Figure 3
Figure 3. CCR2 reporter expression segregates a monocytic CD11b+ myeloid derived suppressor cell in the tumor-bearing host
CCR2 reporter mice (4–8/group) were inoculated with B16-GM or B16 tumor cells in Matrigel. Tumors and spleens were harvested after 2 weeks or when tumors were of equivalent size (500–800mg) and analyzed for GFP expression in CD45+CD11b+ cells by flow cytometry. The quantity of CD11b+GFP+(CCR2+) and GFP−(CCR2−) cells as a percentage of the immune infiltrate (%CD45+ cells) is shown. One representative spleen sample is depicted to show each population. Data is composite of 2 separate experiments (A). In separate experiments cytospins of flow-sorted cells were stained with a Diff-Quick stain set (Dade Behring, inc.) and evaluated at 40X magnification (B). Single cell suspensions harvested from tumors and spleens 2 weeks after tumor inoculation were flow-sorted for CD11b+CD45+ cells and then additionally sorted for CCR2+ or − populations based on GFP reporter expression. Each of the three subsets was individually tested for its ability to suppress the proliferation of CD8+ T cells stimulated with α-CD3/α-CD28 antibody (Stim). Stim + are wells without CD11b+ cells and Stim − are wells without MDSC or antibody. Proliferation was measured after 72 hours of co-culture with the indicated ratio of MDSC (C).
Figure 4
Figure 4. GM-CSF expands and activates monocytic CCR2+ CD11b+ MDSC that suppress CD8+ T cell proliferation via the coordinated action of iNOS and arginase in a contact dependent fashion
CCR2-GFP mice (3–6/group) were subcutaneously inoculated with B16-GM embedded in Matrigel. Single cell suspensions harvested from spleens 2 weeks later were flow-sorted for CD11b+CD45+ CCR2 reporter + cells (MDSC), which were added to CD8+ T cells stimulated with α-CD3/α-CD28 antibody. Proliferation was measured after 72 hours of co-culture in the indicated conditions (A). CD8+ T cell suppressive capability measured with MDSC in contact with CD8+ T cells or placed inside a transwell (0.4 μM) insert (A). CD8+ T cell proliferation in the presence of inhibitors of iNOS (L-NMMA) and/or arginase (Nor-NOHA); proliferation is normalized across assays to the baseline proliferation in the absence of CCR2+CD11b+ MDSC (B). One representative experiment of 2 similar replicates is shown in A. In B combined results from 3 individual assays are shown. * P < 0.05
Figure 5
Figure 5. CCR2 signaling is not required for MDSC function
CCR2-GFP transgene positive mice on a CCR2-wt or CCR2−/− background were inoculated with B16-GM tumors in Matrigel. Tissues were harvested on day 11 after inoculation and CD11b+GFP+ cells enumerated by flow cytometry. Representative flow cytometry plots (A). Quantitative data (n=5/group) showing quantity of CD11b+GFP+ cells expressed as a percent of single, live, CD45+ cells(B). CD45+CD11b+GFP+ cells were sorted from tumor or spleen of animals challenged with B16-GM tumors 14 days prior and added to CD8 T cells stimulated with α-CD3/α-CD28 antibody. Proliferation was measured after 72 hours of co-culture with the indicated ratio of MDSC (C). One of 2 (A,B) or 3 (C) representative experiments is shown.
Figure 6
Figure 6. Depletion of CCR2+ cells increases antigen specific T cells in the tumor microenvironment and results in diminished tumor growth
CD8+ pmel cells were magnetically sorted for adoptive transfer experiments from spleen cells previously stimulated in vitro with soluble α-CD3 (1 μg/ml)/α-CD28 (2 μg/ml) antibody for 72 hours and IL-2 (30 million units/ml) for 24 hours. Diphtheria toxin receptor transgene (CCR2-DTR Tg) positive and transgene negative (Tg−) mice were inoculated with 1.25 × 10⁵ B16-GM i.d. and treated with daily injections of diphtheria toxoid 250ng intraperitoneally on day 8 –13. Monocytic and granulocytic myeloid cell subsets in the tumor microenvironment of Tg+ and Tg− mice after treatment (A). Adoptively transferred T cell accumulation at the tumor site of Tg+ and Tg− mice 6 days after the transfer of 6×10⁵ activated CD8+ pmel T cells in representative mice (B) and average in each group of 5 mice at the tumor site and draining lymph node (C). Tumor growth in mice (n=10–12/group) treated with increasing doses of CD8+ pmel T cell transfer and DT (D). Individual effect of administration of DT versus increasing doses of CD8 pmels; *p<0.05, *** p<0.0001(E). One representative example is shown of 2–3 similar experiments for each figure.
Figure 7
Figure 7. CCR2 expression on melanoma patient MDSC
Healthy donor(HD) or stage III and IV melanoma patient(Pt) PBMC were evaluated by flow cytometry for the quantity of lineage negative (CD3, CD16, CD19, CD20, CD56), CD14+, HLA-DR low/neg cells (A). The expression of CCR2 was measured in comparison with isotype control in each subject (n = 3 HD, 3 Pt) (B). PBMC depleted of CCR2 expressing cells were stimulated to proliferate with OKT-3 and IL-2. CFSE dilution of CD8 T cells in the culture is shown in the absence of CCR2+ cells or with CCR2+ cells added back. The average stimulation index is graphed for 3 healthy donor and 3 melanoma patient PBMC (C). Stimulation index = (%proliferated CD8+ T cells in CCR2 depleted PBMC) ÷ (% proliferated CD8+ T cell in CCR2-PBMC with CCR2+ cell added back).

Similar articles

Cited by

References

    1. Turk MJ, Guevara-Patino JA, Rizzuto GA, Engelhorn ME, Sakaguchi S, Houghton AN. Concomitant tumor immunity to a poorly immunogenic melanoma is prevented by regulatory T cells. J Exp Med. 2004;200:771–782. - PMC - PubMed
    1. Quezada SA, Peggs KS, Simpson TR, Shen Y, Littman DR, Allison JP. Limited tumor infiltration by activated T effector cells restricts the therapeutic activity of regulatory T cell depletion against established melanoma. J Exp Med. 2008;205:2125–2138. - PMC - PubMed
    1. Peranzoni E, Zilio S, Marigo I, et al. Myeloid-derived suppressor cell heterogeneity and subset definition. Curr Opin Immunol. 2010;22:238–244. - PubMed
    1. Gabrilovich DI, Nagaraj S. Myeloid-derived suppressor cells as regulators of the immune system. Nat Rev Immunol. 2009;9:162–174. - PMC - PubMed
    1. Small E, Demkow T, Gerritsen WR, et al. A phase III trial of GVAX immunotherapy for prostate cancer in combination with docetaxel vs. docetaxel plus prednisone in symptomatic, castration-resistant prostate cancer (CRPC) ASCO GU; 2009. p. Abs 7.

Publication types

MeSH terms

Substances