

Coherent conformational degrees of freedom as a structural basis for allosteric communication
- PMID: 22174669
- PMCID: PMC3234217
- DOI: 10.1371/journal.pcbi.1002301
Coherent conformational degrees of freedom as a structural basis for allosteric communication
Abstract
Conformational changes in allosteric regulation can to a large extent be described as motion along one or a few coherent degrees of freedom. The states involved are inherent to the protein, in the sense that they are visited by the protein also in the absence of effector ligands. Previously, we developed the measure binding leverage to find sites where ligand binding can shift the conformational equilibrium of a protein. Binding leverage is calculated for a set of motion vectors representing independent conformational degrees of freedom. In this paper, to analyze allosteric communication between binding sites, we introduce the concept of leverage coupling, based on the assumption that only pairs of sites that couple to the same conformational degrees of freedom can be allosterically connected. We demonstrate how leverage coupling can be used to analyze allosteric communication in a range of enzymes (regulated by both ligand binding and post-translational modifications) and huge molecular machines such as chaperones. Leverage coupling can be calculated for any protein structure to analyze both biological and latent catalytic and regulatory sites.
Conflict of interest statement
The authors have declared that no competing interests exist.
Figures
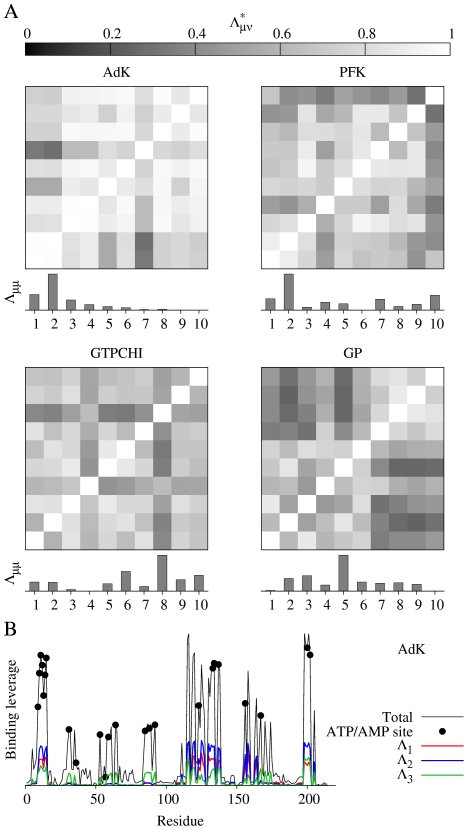
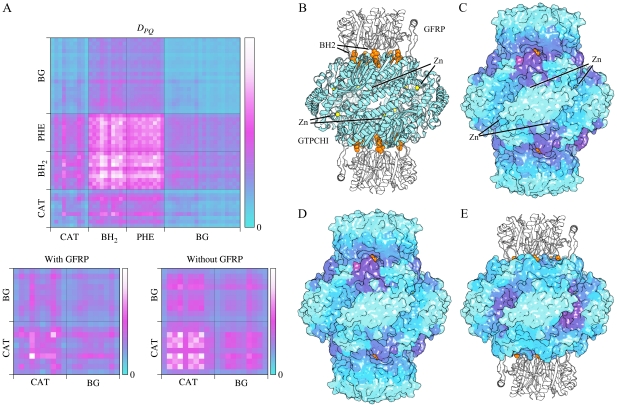
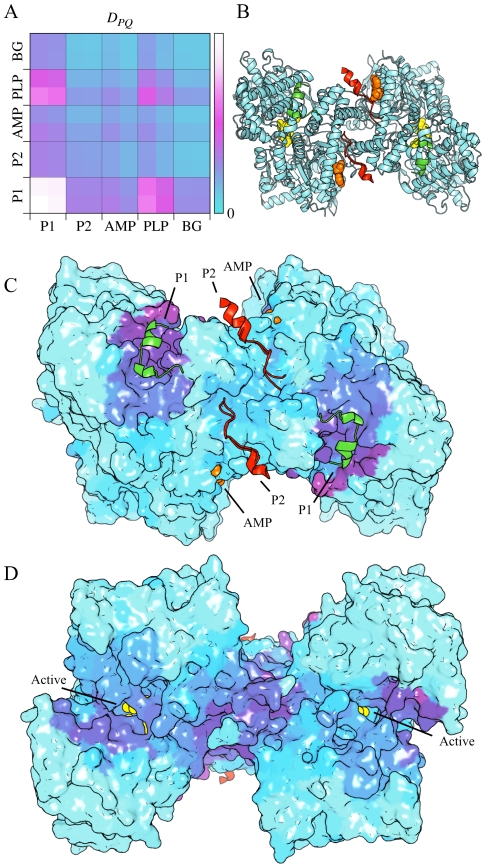
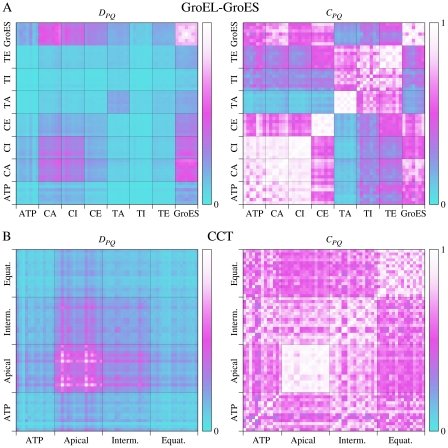
 measuring similarity between leverage profiles for different normal modes μ and ν, for 4 of the proteins studied. The magnitude of the leverage profiles
  are also plotted to indicate which are the most important modes. (B) The total leverage profile and the three most important individual leverage profiles for AdK (Λ
1, Λ
2, and Λ
3). The average total binding leverage for the residues at the active site are indicated by black circles.
are also plotted to indicate which are the most important modes. (B) The total leverage profile and the three most important individual leverage profiles for AdK (Λ
1, Λ
2, and Λ
3). The average total binding leverage for the residues at the active site are indicated by black circles.
References
-
- Monod J, Jacob F. Teleonomic mechanisms in cellular metabolism, growth, and differentiation. Cold Spring Harb Symp Quant Biol. 1961;26:389–401. - PubMed
-
- Monod J, Wyman J, Changeux JP. On the Nature of Allosteric Transitions: A Plausible Model. J Mol Biol. 1965;12:88–118. - PubMed
-
- Koshland DE, Jr, Nemethy G, Filmer D. Comparison of experimental binding data and theoretical models in proteins containing subunits. Biochemistry. 1966;5:365–385. - PubMed
Publication types
MeSH terms
Substances
Associated data
- Actions
- Actions
- Actions
- Actions
- Actions
- Actions
- Actions
- Actions
- Actions
- Actions
- Actions
LinkOut - more resources
Full Text Sources
