. 2011 Dec;7(12):e1002354.
doi: 10.1371/journal.ppat.1002354. Epub 2011 Dec 8.

A receptor-based switch that regulates anthrax toxin pore formation

Affiliations

A receptor-based switch that regulates anthrax toxin pore formation

Rosemarie M Pilpa et al. PLoS Pathog. 2011 Dec.

Abstract

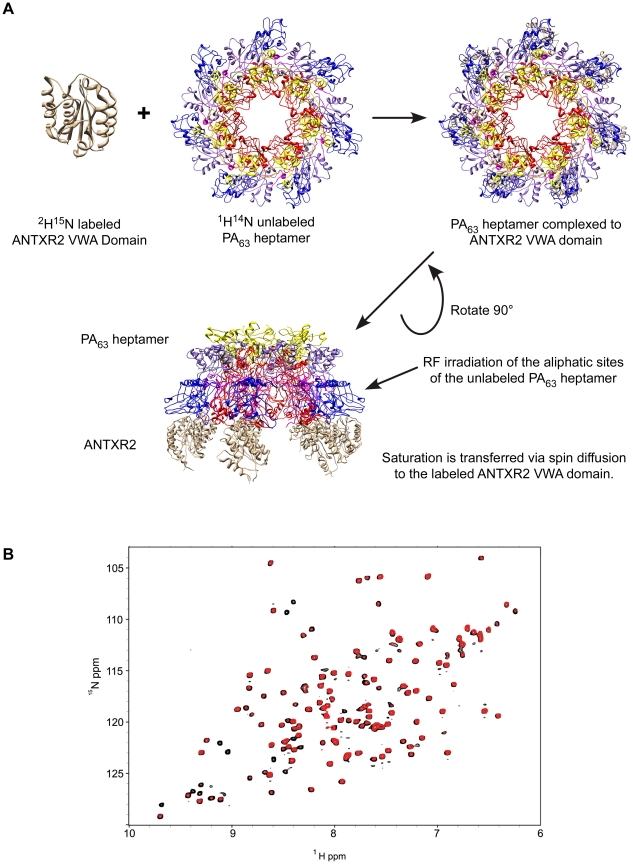
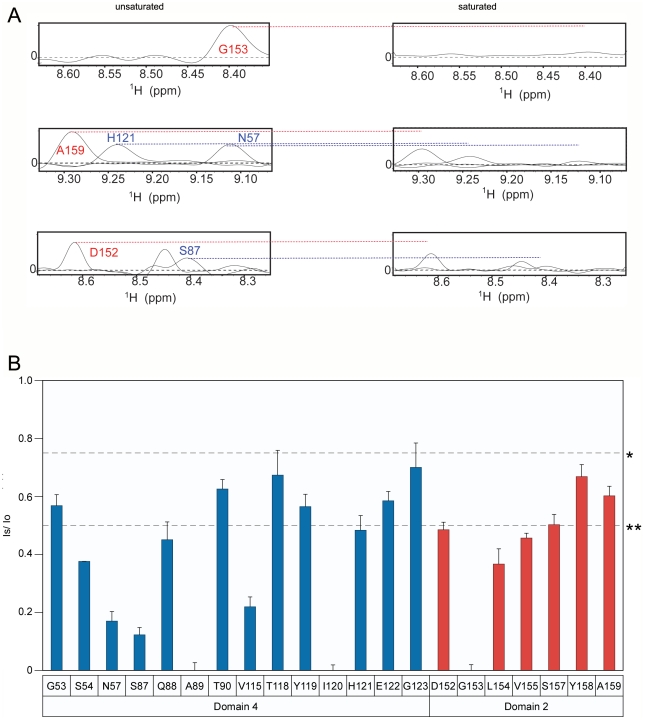
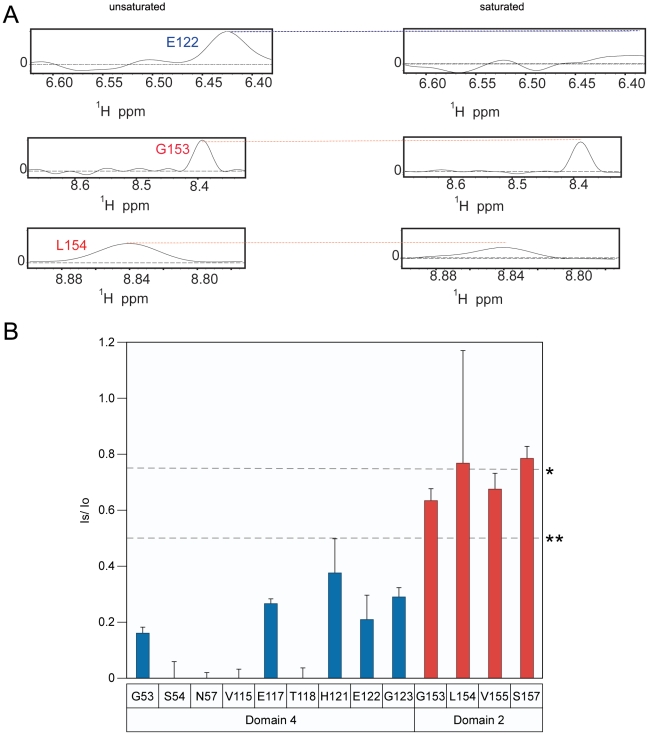
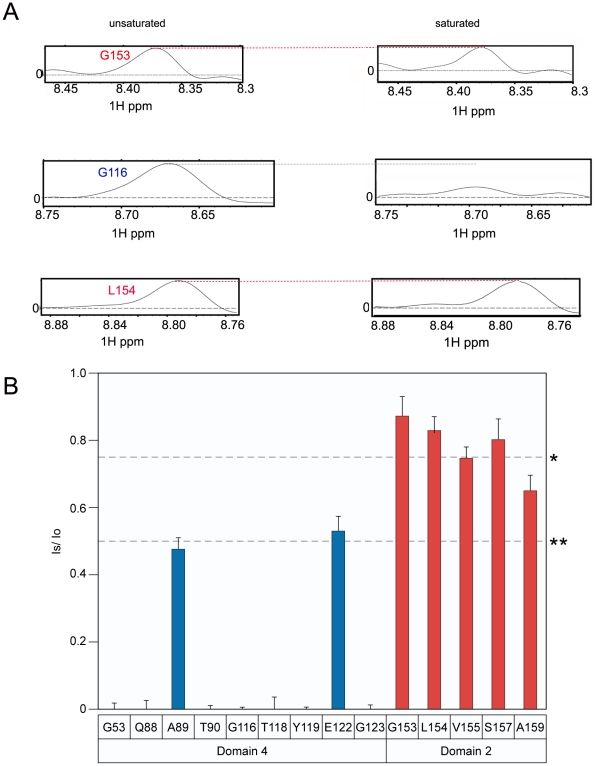
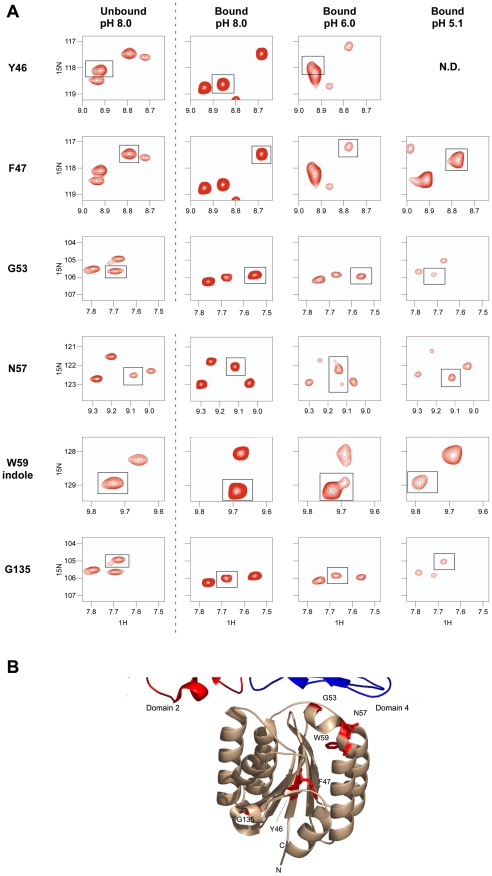
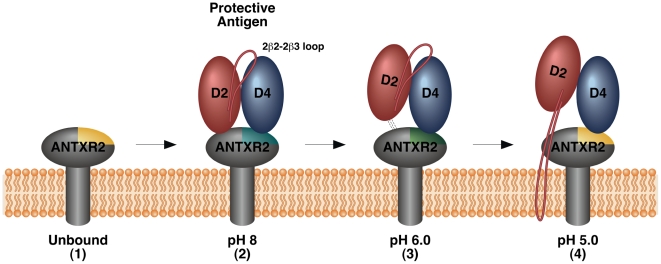
Cellular receptors can act as molecular switches, regulating the sensitivity of microbial proteins to conformational changes that promote cellular entry. The activities of these receptor-based switches are only partially understood. In this paper, we sought to understand the mechanism that underlies the activity of the ANTXR2 anthrax toxin receptor-based switch that binds to domains 2 and 4 of the protective antigen (PA) toxin subunit. Receptor-binding restricts structural changes within the heptameric PA prepore that are required for pore conversion to an acidic endosomal compartment. The transfer cross-saturation (TCS) NMR approach was used to monitor changes in the heptameric PA-receptor contacts at different steps during prepore-to-pore conversion. These studies demonstrated that receptor contact with PA domain 2 is weakened prior to pore conversion, defining a novel intermediate in this pathway. Importantly, ANTXR2 remained bound to PA domain 4 following pore conversion, suggesting that the bound receptor might influence the structure and/or function of the newly formed pore. These studies provide new insights into the function of a receptor-based molecular switch that controls anthrax toxin entry into cells.


Conflict of interest statement

The authors have declared that no competing interests exist.

Figures

Figure 1
Figure 1. A) 1H-15N TROSY-HSQC of the ANTXR2 VWA domain.
Cross-peaks with labeled assignments represent receptor residues at the PA domain 2 and domain 4 interaction surfaces. B) The crystal structure of the interface between monomeric PA83 bound to ANTXR2 (PDB 1T6B; Protein Data Bank), showing the base regions of domain 2 and 4 of PA. Representative PA contact residues of ANTXR2 are indicated: domain 2 contact sites are in hot pink and domain 4 contacts are in cyan. All images were generated using PymolX11 (DeLano Scientific, San Carlos, CA).
Figure 2
Figure 2. The principle of Transferred Cross Saturation (TCS) applied to the (PA63)7-ANTXR2 complex.
A) Schematic of TCS between ANTXR2 VWA domain and the PA63 pore. 2H15N-labeled ANTXR2 VWA-domain was mixed at a ratio of (10∶1) with PA63 heptamer. Radiofrequency pulses were applied to the sample, in order to saturate the aliphatic protons of the PA63 heptamer. Saturation is then transferred to the contact residues of the labeled ANTXR2 VWA-domain, reducing the intensity of the corresponding cross peaks in the spectrum. B) Saturated and unsaturated spectra of the (PA63)7-ANTXR2 complex at pH 8.0. The [1H,15N] TROSY-HSQC spectra of the 2H-15N labeled ANTXR2-VWA domain complexed with the PA63 heptameric prepore are shown overlayed under saturating or non-saturating (black) conditions.
Figure 3
Figure 3. The receptor contact residues with PA domain 2 and 4 that are saturated at pH 8.0.
A) A subset of the 1D slices of the [15N,1H] TROSY-HSQC spectra obtained at pH 8.0 highlighting several cross-peaks without saturation at pH 8 (left panels) or with saturation at pH 8 (right panels). Cross-peaks representing PA domain 2 and 4 contact residues are indicated with red and blue labels, respectively. B) A plot of the intensity ratio (Is/Io) of the transferred cross saturation of (PA63)7 and the interacting residues on the ANTXR2 VWA domain. Significant cross saturation (Is/Io≤0.75) is indicated with a single asterisk, and highly significant (Is/Io≤0.5) is indicated with a double asterisk. The errors were calculated by propagating the base-plane noise, which was derived from the signal-to-noise ratios of both control and the saturated spectra and this value was averaged from two duplicate experiments.
Figure 4
Figure 4. The receptor contact with PA domain 2 is weakened at pH 6.0.
A) A subset of the 1D slices of the [15N,1H] TROSY-HSQC spectra obtained at pH 6.0 highlighting several cross-peaks without saturation at pH 6 (left panels) or with saturation at pH 6 (right panels). Cross-peaks representing PA domain 2 and 4 contact residues are indicated with red and blue labels, respectively. B) A plot of the intensity ratio (Is/Io) from the transferred cross saturation of (PA63)7 heptamer to interacting residues on the ANTXR2 VWA-domain. Significant cross saturation (Is/Io≤0.75) is indicated with a single asterisk, and highly significant (Is/Io≤0.5) is indicated with a double asterisk. The errors were calculated by propagating the base-plane noise, which was derived from the signal-to-noise ratios of both control and the saturated spectra and this value was averaged from two duplicate experiments.
Figure 5
Figure 5. Receptor remains bound to PA domain 4 at pH 5.1.
A) A subset of the 1D slices of the [15N,1H] TROSY-HSQC spectra highlighting several cross-peaks without saturation at pH 5.1 (left panels) or with saturation at pH 5.1 (right panels). Cross-peaks representing PA domain 2 and 4 contact residues are indicated with red and blue labels, respectively. B) A plot of the intensity ratio (Is/Io) from the transferred cross saturation of (PA63)7 to interacting residues on the ANTXR2 VWA domain. Significant cross saturation (Is/Io≤0.75) is indicated with a single asterisk, and highly significant (Is/Io≤0.5) is indicated with a double asterisk. For all graphs the errors were calculated by propagating the base-plane noise, which was derived from the signal-to-noise ratios of both interleaved experiments. The data was taken from two separate experiments performed at pH 5.1 and pH 5.15 and the average was derived from these experiments.
Figure 6
Figure 6. Chemical shift changes of the ANTXR2 spectra due to PA binding at several pH values.
A) Chemical shift changes are shown for residues Y46, F47, G53, N57, the W59 indole, and G135, by comparing the unbound VWA domain at pH 8 (left panel) with the bound VWA-(PA63)7 complex at different pH values (right panels). N.D: Not Determined; Residue Y46 was not resolved at pH 5.1 B) Chemical shift perturbation of the ANTXR2 VWA domain upon PA63 heptamer binding. Chemical shift perturbations were seen for residues Y46, F47, G53, N57, the W59 indole, and G135 upon PA63 heptamer binding. These residues are modeled onto the crystal structure of the ANTXR2 VWA domain and highlighted in red.
Figure 7
Figure 7. Model of changes in the PA-receptor contacts that accompany toxin prepore-to-pore conversion.
For clarity, only domains 2 and 4 of a single PA monomer are shown with the receptor. 1. The unbound receptor with the PA Domain 4 binding site highlighted in yellow to indicate its “unbound” configuration. 2. The receptor binds to PA domains 2 and 4 forming a molecular clamp that blocks pore formation and inducing a conformational change in PA domain 4 contact residues (indicated with cyan shading). 3. At pH 6 which is similar to the conditions in an early endosomal compartment, the receptor contacts with PA domain 2 are weakened and PA domain 4 contact residues begin to revert back to their “unbound” configuration” (indicated with green shading). Additional allosteric effects are also detected at this pH value. 4. At ∼pH 5 which is similar to the conditions in a late endosomal compartment, PA domain 2 is no longer bound to receptor, presumably permitting movement of the 2β2-2β3 region of PA to mediate pore formation. The receptor remains bound to PA domain 4 after pore formation although certain PA domain 4 binding residues of the receptor revert back to their “unbound” configuration (indicated with yellow shading). The bound receptor may stabilize the structure and/or modify the function of the newly formed pore.

Similar articles

Cited by

References

    1. Cote M, Zheng YM, Liu SL. Receptor binding and low pH coactivate oncogenic retrovirus envelope-mediated fusion. J Virol. 2009;83:11447–11455. - PMC - PubMed
    1. Melikyan GB, Barnard RJ, Abrahamyan LG, Mothes W, Young JA. Imaging individual retroviral fusion events: from hemifusion to pore formation and growth. Proc Natl Acad Sci U S A. 2005;102:8728–8733. - PMC - PubMed
    1. Finzi A, Xiang SH, Pacheco B, Wang L, Haight J, et al. Topological layers in the HIV-1 gp120 inner domain regulate gp41 interaction and CD4-triggered conformational transitions. Mol Cell. 2010;37:656–667. - PMC - PubMed
    1. Navaratnarajah CK, Oezguen N, Rupp L, Kay L, Leonard VH, et al. The heads of the measles virus attachment protein move to transmit the fusion-triggering signal. Nat Struct Mol Biol. 2011;18:128–134. - PMC - PubMed
    1. Connolly SA, Jackson JO, Jardetzky TS, Longnecker R. Fusing structure and function: a structural view of the herpesvirus entry machinery. Nat Rev Microbiol. 2011;9:369–381. - PMC - PubMed

Publication types

MeSH terms