Cryptic fitness advantage: diploids invade haploid populations despite lacking any apparent advantage as measured by standard fitness assays
- PMID: 22174734
- PMCID: PMC3235103
- DOI: 10.1371/journal.pone.0026599
Cryptic fitness advantage: diploids invade haploid populations despite lacking any apparent advantage as measured by standard fitness assays
Abstract
Ploidy varies tremendously within and between species, yet the factors that influence when or why ploidy variants are adaptive remains poorly understood. Our previous work found that diploid individuals repeatedly arose within ten replicate haploid populations of Saccharomyces cerevisiae, and in each case we witnessed diploid takeover within ~1800 asexual generations of batch culture evolution in the lab. The character that allowed diploids to rise in frequency within haploid populations remains unknown. Here we present a number of experiments conducted with the goal to determine what this trait (or traits) might have been. Experiments were conducted both by sampling a small number of colonies from the stocks frozen every two weeks (~ 93 generations) during the original experiment, as well through sampling a larger number of colonies at the two time points where polymorphism for ploidy was most prevalent. Surprisingly, none of our fitness component measures (lag phase, growth rate, biomass production) indicated an advantage to diploidy. Similarly, competition assays against a common competitor and direct competition between haploid and diploid colonies isolated from the same time point failed to indicate a diploid advantage. Furthermore, we uncovered a tremendous amount of trait variation among colonies of the same ploidy level. Only late-appearing diploids showed a competitive advantage over haploids, indicating that the fitness advantage that allowed eventual takeover was not diploidy per se but an attribute of a subset of diploid lineages. Nevertheless, the initial rise in diploids to intermediate frequency cannot be explained by any of the fitness measures used; we suggest that the resolution to this mystery is negative frequency-dependent selection, which is ignored in the standard fitness measures used.
Conflict of interest statement
Figures


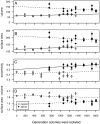
 0.05) while dashed lines indicate a nonsignificant trend (p
 0.5). Here and in later figures, error bars represent
  1 SE.
1 SE.


 m) is the difference in malthusian growth rate between the given strain and the common competitor.

Similar articles
-
Haploids adapt faster than diploids across a range of environments.J Evol Biol. 2011 Mar;24(3):531-40. doi: 10.1111/j.1420-9101.2010.02188.x. Epub 2010 Dec 16. J Evol Biol. 2011. PMID: 21159002
-
Haploidy, diploidy and evolution of antifungal drug resistance in Saccharomyces cerevisiae.Genetics. 2004 Dec;168(4):1915-23. doi: 10.1534/genetics.104.033266. Epub 2004 Sep 15. Genetics. 2004. PMID: 15371350 Free PMC article.
-
Evolution of haploid-diploid life cycles when haploid and diploid fitnesses are not equal.Evolution. 2017 Feb;71(2):215-226. doi: 10.1111/evo.13125. Epub 2016 Dec 1. Evolution. 2017. PMID: 27859032
-
[Relative competitiveness of haploid and diploid yeast cells growing in a mixed population].Mikrobiologiia. 1989 Sep-Oct;58(5):769-77. Mikrobiologiia. 1989. PMID: 2699648 Russian.
-
Experimental studies on ploidy evolution in yeast.FEMS Microbiol Lett. 2004 Apr 15;233(2):187-92. doi: 10.1111/j.1574-6968.2004.tb09481.x. FEMS Microbiol Lett. 2004. PMID: 15108721 Review.
Cited by
-
Adaptive genome duplication affects patterns of molecular evolution in Saccharomyces cerevisiae.PLoS Genet. 2018 May 25;14(5):e1007396. doi: 10.1371/journal.pgen.1007396. eCollection 2018 May. PLoS Genet. 2018. PMID: 29799840 Free PMC article.
-
Mutational effects depend on ploidy level: all else is not equal.Biol Lett. 2013 Feb 23;9(1):20120614. doi: 10.1098/rsbl.2012.0614. Epub 2012 Oct 10. Biol Lett. 2013. PMID: 23054913 Free PMC article.
-
The genome-wide rate and spectrum of spontaneous mutations differ between haploid and diploid yeast.Proc Natl Acad Sci U S A. 2018 May 29;115(22):E5046-E5055. doi: 10.1073/pnas.1801040115. Epub 2018 May 14. Proc Natl Acad Sci U S A. 2018. PMID: 29760081 Free PMC article.
-
Ancient evolutionary trade-offs between yeast ploidy states.PLoS Genet. 2013 Mar;9(3):e1003388. doi: 10.1371/journal.pgen.1003388. Epub 2013 Mar 21. PLoS Genet. 2013. PMID: 23555297 Free PMC article.
-
Parasexual Ploidy Reduction Drives Population Heterogeneity Through Random and Transient Aneuploidy in Candida albicans.Genetics. 2015 Jul;200(3):781-94. doi: 10.1534/genetics.115.178020. Epub 2015 May 18. Genetics. 2015. PMID: 25991822 Free PMC article.
References
-
- Gould SJ, Lewontin RC. The spandrels of San Marco and the Panglossian paradigm: a critique of the adaptationist programme. Proc R Soc Lond B Biol Sci. 1979;205:581–98. - PubMed
-
- Pandit MK, Pocock MO, Kunin WE. Ploidy influences rarity and invasiveness in plants. J Ecol. 2011;99 no. doi: 10.1111/j.1365-2745.2011.01838.x.
-
- Ezov TK, Boger-Nadjar E, Frenkel Z, Katsperovski I, Kemeny S, et al. Molecular- genetic biodiversity in a natural population of the yeast Saccharomyces cerevisiae from “Evolution Canyon”: Microsatellite polymorphism, ploidy and controversial sexual status. Genetics. 2006;174:1455–1468. - PMC - PubMed
Publication types
MeSH terms
LinkOut - more resources
Full Text Sources
Molecular Biology Databases
Miscellaneous

