

Atlantic bluefin tuna: a novel multistock spatial model for assessing population biomass
- PMID: 22174745
- PMCID: PMC3235089
- DOI: 10.1371/journal.pone.0027693
Atlantic bluefin tuna: a novel multistock spatial model for assessing population biomass
Abstract
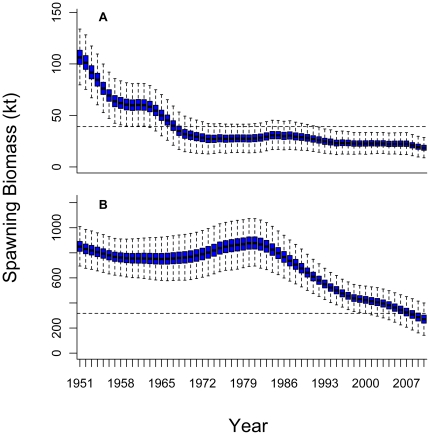
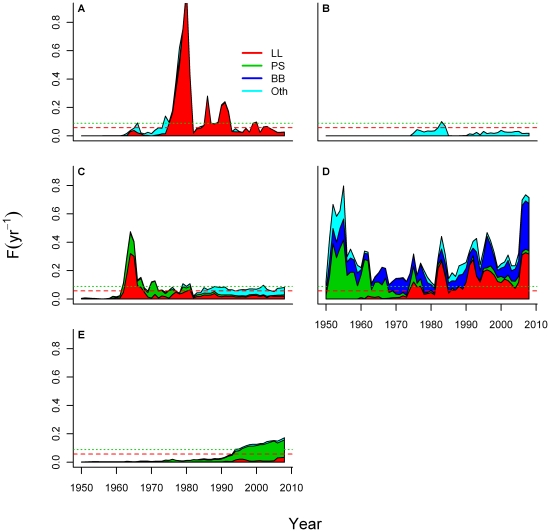
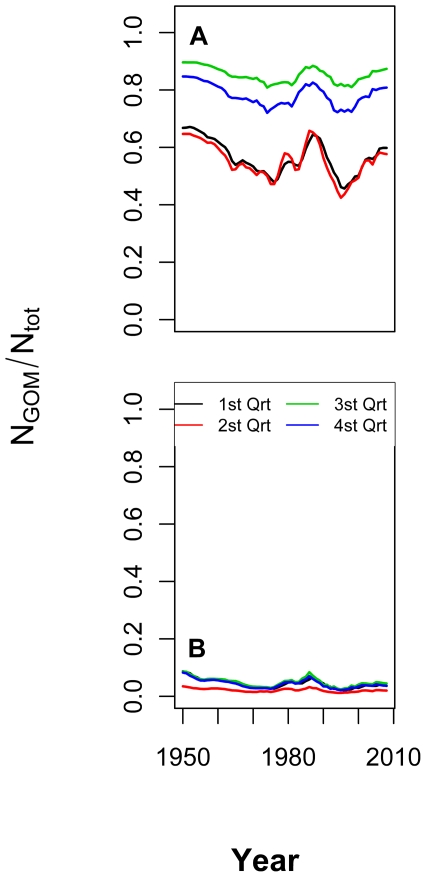
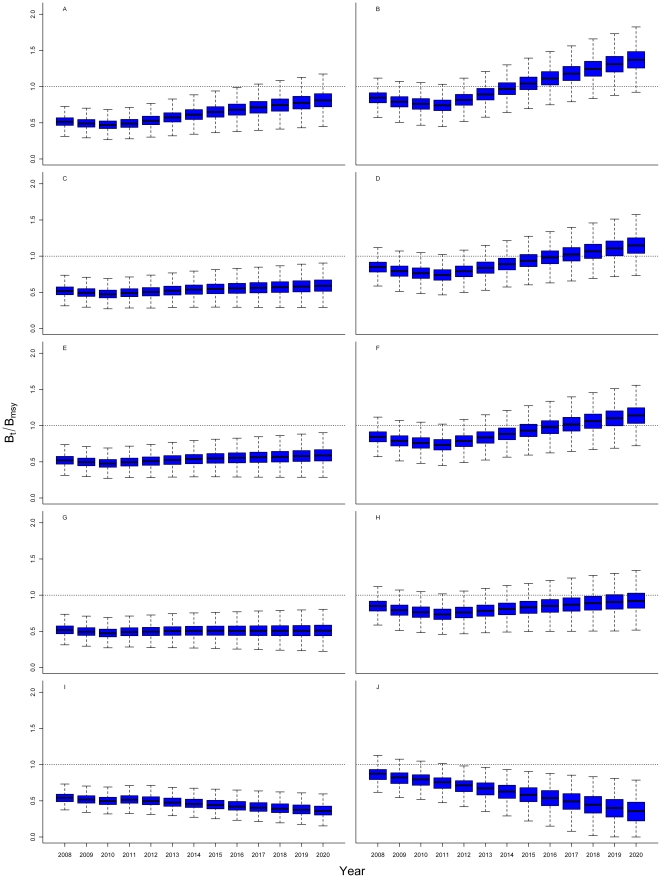
Atlantic bluefin tuna (Thunnus thynnus) is considered to be overfished, but the status of its populations has been debated, partly because of uncertainties regarding the effects of mixing on fishing grounds. A better understanding of spatial structure and mixing may help fisheries managers to successfully rebuild populations to sustainable levels while maximizing catches. We formulate a new seasonally and spatially explicit fisheries model that is fitted to conventional and electronic tag data, historic catch-at-age reconstructions, and otolith microchemistry stock-composition data to improve the capacity to assess past, current, and future population sizes of Atlantic bluefin tuna. We apply the model to estimate spatial and temporal mixing of the eastern (Mediterranean) and western (Gulf of Mexico) populations, and to reconstruct abundances from 1950 to 2008. We show that western and eastern populations have been reduced to 17% and 33%, respectively, of 1950 spawning stock biomass levels. Overfishing to below the biomass that produces maximum sustainable yield occurred in the 1960s and the late 1990s for western and eastern populations, respectively. The model predicts that mixing depends on season, ontogeny, and location, and is highest in the western Atlantic. Assuming that future catches are zero, western and eastern populations are predicted to recover to levels at maximum sustainable yield by 2025 and 2015, respectively. However, the western population will not recover with catches of 1750 and 12,900 tonnes (the "rebuilding quotas") in the western and eastern Atlantic, respectively, with or without closures in the Gulf of Mexico. If future catches are double the rebuilding quotas, then rebuilding of both populations will be compromised. If fishing were to continue in the eastern Atlantic at the unregulated levels of 2007, both stocks would continue to decline. Since populations mix on North Atlantic foraging grounds, successful rebuilding policies will benefit from trans-Atlantic cooperation.
Conflict of interest statement
Figures
References
-
- Neilson JD, Campana SE. A validated description of age and growth of western Atlantic bluefin tuna (Thunnus thynnus). Can J Fish Aquat Sci. 2008;65:1523–1527.
-
- Maigret J, Ly B. Campiegne Sciences Nat; 1986. Les Poissons de Mer de Mauritanie.213
-
- Gibbs R, Collette B. Comparative anatomy and systematics of the tunas, genus Thunnus. US Fish Wild Seri Fish Bull. 1967;66:65–130.
-
- Mather F, Mason JM, Jones A. Miami, Florida: United States Department of Commerce; 1995. Historical document: Life History and Fisheries of Atlantic Bluefin tuna.165
-
- Fromentin JM. Descriptive analysis of the ICCAT bluefin tuna tagging database. Col Vol Sci Pap ICCAT. 2002;54:353–362.
Publication types
MeSH terms
LinkOut - more resources
Full Text Sources
Miscellaneous
