. 2011;6(12):e28385.
doi: 10.1371/journal.pone.0028385. Epub 2011 Dec 7.

Functional and transcriptional induction of aquaporin-1 gene by hypoxia; analysis of promoter and role of Hif-1α

Affiliations

Functional and transcriptional induction of aquaporin-1 gene by hypoxia; analysis of promoter and role of Hif-1α

Irene Abreu-Rodríguez et al. PLoS One. 2011.

Abstract

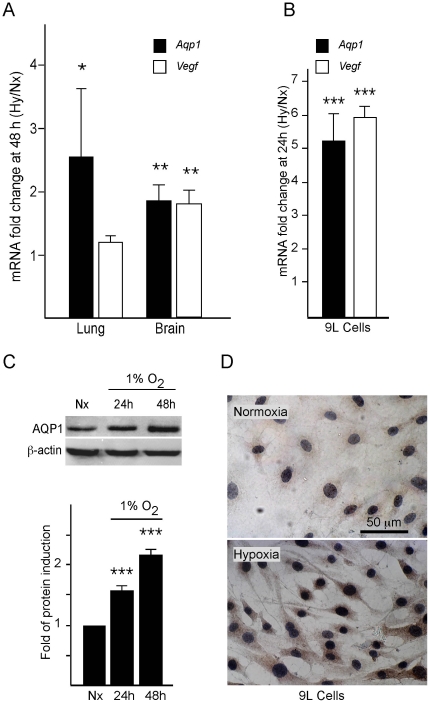
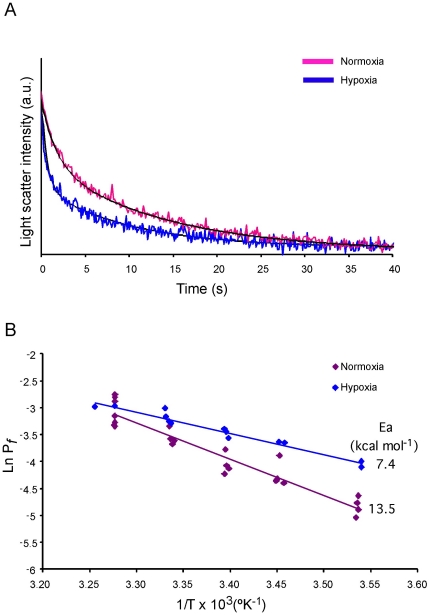
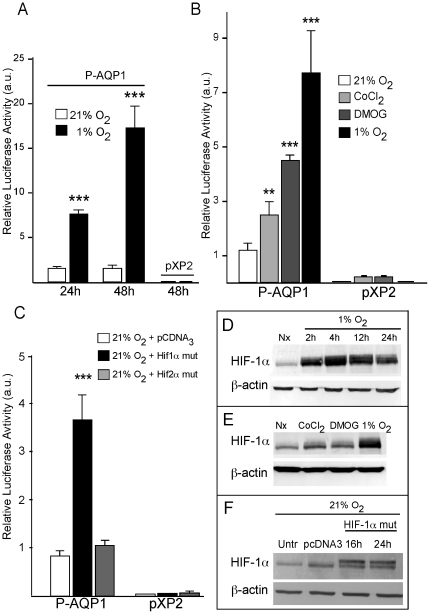
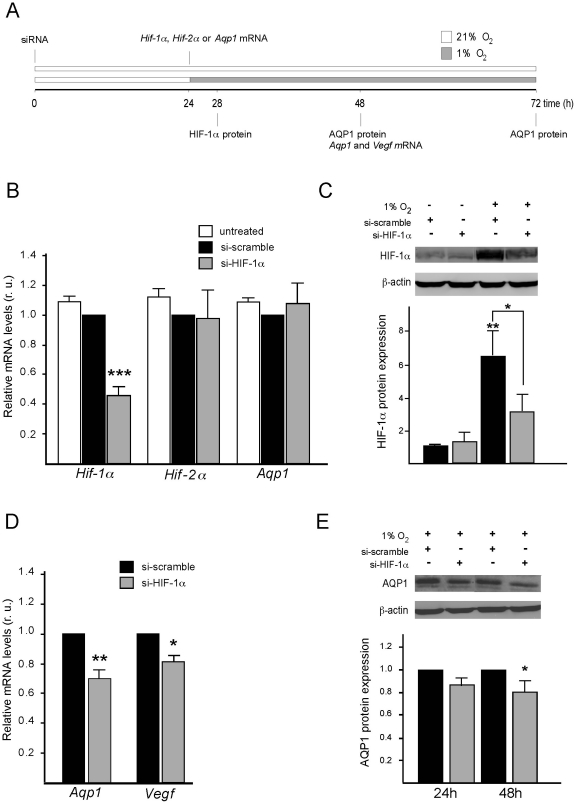
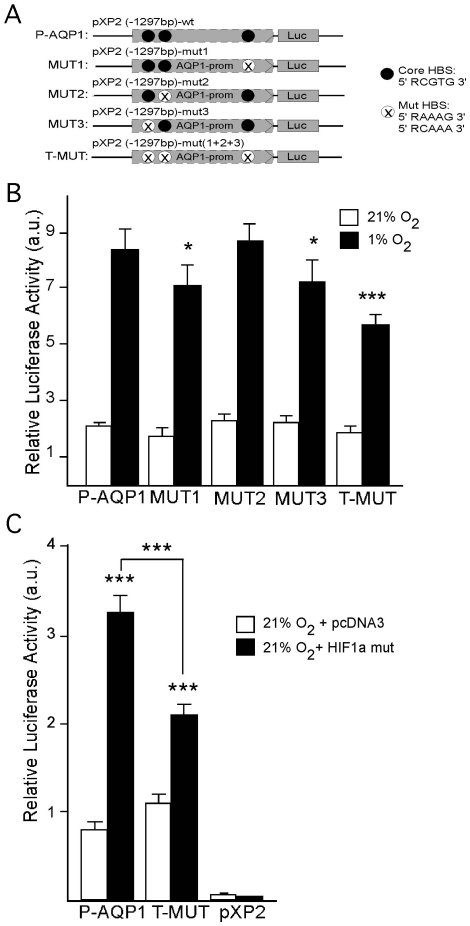
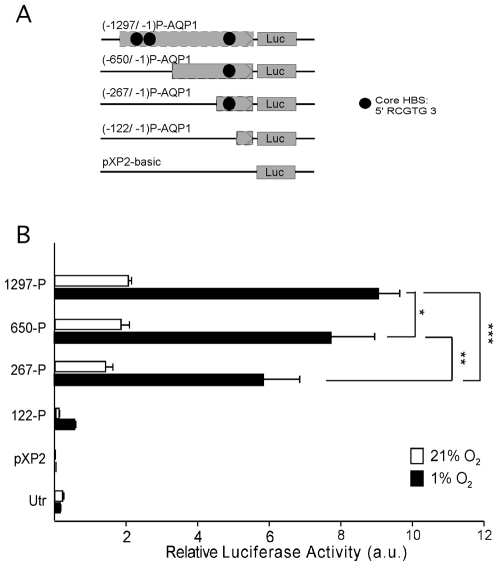
Aquaporin-1 (AQP1) is a water channel that is highly expressed in tissues with rapid O(2) transport. It has been reported that this protein contributes to gas permeation (CO(2), NO and O(2)) through the plasma membrane. We show that hypoxia increases Aqp1 mRNA and protein levels in tissues, namely mouse brain and lung, and in cultured cells, the 9L glioma cell line. Stopped-flow light-scattering experiments confirmed an increase in the water permeability of 9L cells exposed to hypoxia, supporting the view that hypoxic Aqp1 up-regulation has a functional role. To investigate the molecular mechanisms underlying this regulatory process, transcriptional regulation was studied by transient transfections of mouse endothelial cells with a 1297 bp 5' proximal Aqp1 promoter-luciferase construct. Incubation in hypoxia produced a dose- and time-dependent induction of luciferase activity that was also obtained after treatments with hypoxia mimetics (DMOG and CoCl(2)) and by overexpressing stabilized mutated forms of HIF-1α. Single mutations or full deletions of the three putative HIF binding domains present in the Aqp1 promoter partially reduced its responsiveness to hypoxia, and transfection with Hif-1α siRNA decreased the in vitro hypoxia induction of Aqp1 mRNA and protein levels. Our results indicate that HIF-1α participates in the hypoxic induction of AQP1. However, we also demonstrate that the activation of Aqp1 promoter by hypoxia is complex and multifactorial and suggest that besides HIF-1α other transcription factors might contribute to this regulatory process. These data provide a conceptual framework to support future research on the involvement of AQP1 in a range of pathophysiological conditions, including edema, tumor growth, and respiratory diseases.


Conflict of interest statement

Competing Interests: The authors have declared that no competing interests exist. The authors want to make clear that CIBERNED is not a commercial company, but on the contrary it is a Public Research Network that contributes to support the authors' research, and in order to keep that affiliation they request that the authors state their name as recognition of their support. This does not alter the authors' adherence to all the PLoS ONE policies on sharing data and materials.

Figures

Figure 1
Figure 1. Hypoxic up-regulation of Aqp1 in vivo.
(A) RT-qPCR analysis showing induction of Aqp1 and Vegf mRNA in lung and brain of mice exposed to hypoxia (10% O2 for 48 h, Hy) with respect to normoxia (48 h at 20% O2, Nx). (B) RT-qPCR analysis showing induction of Aqp1 and Vegf mRNAs in the glioblastoma (9L) cell line incubated in hypoxic (1% O2 for 24 h) or normoxic conditions. All values were normalized to the normoxic levels of mRNA and are presented as means ± SEM (N≥3), *P≤0.05, **P≤0.01, *** P≤0.001. (C) Representative western blot analysis of AQP1 in normoxic cells or after 24 and 48 h of hypoxic treatment (1% O2) and a summary of quantification data obtained from at least 3 independent experiments (N = 3). β-actin was used as control for protein loading. (D) Immunohistochemistry assay of AQP1 expression in 9L cells kept under normoxic conditions or exposed to hypoxia (1% O2 for 48 h). Brown immunostaining indicates the presence of AQP1; nuclei were stained with hematoxylin.
Figure 2
Figure 2. Effect of hypoxia on the water permeability of 9L cells.
(A) Normalized scattered light intensity obtained from stopped-flow experiments at 10°C in suspended 9L cells subjected to an osmotic gradient of 150 mOsM/l with mannitol. Cells were pre-exposed in normoxic or 1% O2 conditions for 48 h before these experiments. The time course of volume change after the osmotic shock was fitted with a double exponential to calculate Pf. (B) Temperature dependence of water transport. Typical Arrhenius plots of water efflux from cells maintained in normoxia or treated in hypoxia are shown. From the slope of these plots the activation energy (Ea) for water transport in 9L cells was calculated. Pf and Ea values were obtained from at least three independent experiments.
Figure 3
Figure 3. Stabilization of HIF1α- induced transcriptional activity of the Aqp1 promoter.
(A) A construct (P-AQP1) in which the reporter firefly luciferase gene was driven by the mouse Aqp1 promoter was transfected into EOMA cells and incubated in normoxia or hypoxia at 1% O2, for 24 or 48 h. The values expressed in arbitrary units represent the ratios of firefly luciferase activity normalized by renilla luciferase activity (firefly/renilla). (B) Relative luciferase activity measured in EOMA cells transfected with P-AQP1 and exposed to hypoxia (1% O2), normoxia (21% O2), or normoxia plus hypoxia mimetics (CoCl2 [100 µM] or DMOG [1 mM]) for 24 h. (C) Relative luciferase activity measured from EOMA cells cotransfected with P-AQP1 and mutated forms of HIF1/2α (HIF1/2α mut). Empty pcDNA3 plasmid was used as loading cDNA for control experiments. Cells transfected with the empty vector (pXP2) were used as negative control. Values are expressed in arbitrary units as means ± SEM (n≥3). ** P≤0.01, *** P≤0.001. (D) Western blot time-course analysis of HIF1α protein in EOMA cells kept in normoxia or exposed to hypoxia (1% O2) for 2, 4, 12 and 24 h. (E) Analysis by western blot of HIF1α protein in EOMA cells after 4 h with CoCl2 (100 µM) or DMOG (1 mM) treatments. (F) Western blot analysis of HIF-1α protein levels in normoxic EOMA cells after 16 and 24 h of transfection with HIF-1α mut plasmid. Non-transfected cells and those transfected with empty pcDNA3 vector were used as controls. β-actin served as protein loading control.
Figure 4
Figure 4. Inhibition by Hif-1α siRNA of Aqp1 mRNA and protein expression.
(A) Schematic diagram of the protocol used in the Hif-1α siRNA experiments. Samples were preincubated for 24 h with 50 nmol/L of either Hif-1α siRNA or scramble siRNA. (B) After 24 h of interference, mRNA levels of Hif-1α, Hif-2α or Aqp1 were analyzed by RT-qPCR. (C) Hypoxic conditions (1% O2) were applied, and 4 h later, the levels of HIF-1α protein were analyzed by western blot. Levels were quantified from three independent experiments (N = 3). (D), After 48 h (24 h of Hif-1α interference and 24 h of hypoxia) mRNA levels of Aqp1 and Vegf were analyzed by RT-qPCR and normalized by values determined with the scramble siRNA. (E) A representative western blot showing levels of Aqp1 protein in cells treated with Hif-1α siRNA or with scramble siRNA after 48 h in hypoxia. Results of three western blot experiments (N = 3) are summarized here. β-actin was used as protein loading control. Values are presented as means ± SEM (n = 4). * P≤0.01, ** P≤0.001.
Figure 5
Figure 5. Functional analysis of putative HIF Binding Sites (HBS) in the Aqp1 promoter.
(A) The three CGTG sites present in P-AQP1 were individually mutated to AAAG (MUT1, MUT2 and MUT3) by site-directed mutagenesis. The three sites were mutated at once on the triple mutant (T-MUT). (B) Wild type (P-AQP1) or mutated constructs were transfected into EOMA cells and incubated for 24 h either in normoxic (21% O2) or at 1% O2 conditions before luciferase activity measurements. Values are presented as means ± SEM (N = 4). (C) Relative luciferase activity measured from EOMA cells cotransfected with either P-AQP1 or T-MUT together with HIF-1α mut or pcDNA3 empty plasmid. Cells were maintained under normoxic conditions for 24 h. Values are presented as means ± SEM (N = 5)* P≤0.05, ***P≤0.001.
Figure 6
Figure 6. Deletion analysis of the Aqp1 promoter.
(A) Schematic diagram of different-size reporter constructs indicating length of the Aqp1 promoter (P-AQP1). (B) Relative luciferase activity measured in EOMA cells transfected with the different constructs and exposed to normoxia or hypoxia (1% O2) for 24 h. One-way analysis of variance (ANOVA) followed by Fisher's LSD test was used to evaluate the statistical significance of differences. Bars represent the mean ± SEM for N = 3 independent experiments. *P≤0.05, ** P≤0.01, *** P≤0.001.

References

    1. Nakhoul NL, Davis BA, Romero MF, Boron WF. Effect of expressing the water channel aquaporin-1 on the CO2 permeability of Xenopus oocytes. Am J Physiol. 1998;274:C543–C548. - PubMed
    1. Herrera M, Hong NJ, Garvin JL. Aquaporin-1 transports NO across cell membranes. Hypertension. 2006;48:157–64. - PubMed
    1. Musa-Aziz RM, Chen LM, Pelletier MF, Boron WF. Relative CO2/NH3 selectivities of AQP1, AQP4, AQP5, AmtB, and RhAG. Proc Natl Acad Sci U S A. 2009;106:5406–5411. - PMC - PubMed
    1. Echevarria M, Muñoz-Cabello AM, Sanchez-Silva R, Toledo-Aral JJ, Lopez-Barneo J. Development of cytosolic hypoxia and HIF stabilization are facilitated by aquaporin 1 expression. J Biol Chem. 2007;282:30207–30215. - PubMed
    1. Muñoz-Cabello AM, Toledo-Aral JJ, López-Barneo J, Echevarría M. Rat adrenal chromaffin cells are neonatal CO2 sensors. J Neuroscience. 2005;25:6631–6640. - PMC - PubMed

Publication types

MeSH terms