. 2011;6(12):e28712.
doi: 10.1371/journal.pone.0028712. Epub 2011 Dec 9.

Regulation of human formyl peptide receptor 1 synthesis: role of single nucleotide polymorphisms, transcription factors, and inflammatory mediators

Affiliations

Regulation of human formyl peptide receptor 1 synthesis: role of single nucleotide polymorphisms, transcription factors, and inflammatory mediators

Heini M Miettinen. PLoS One. 2011.

Abstract

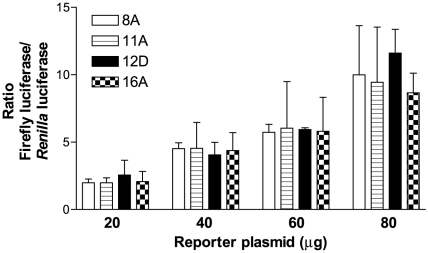
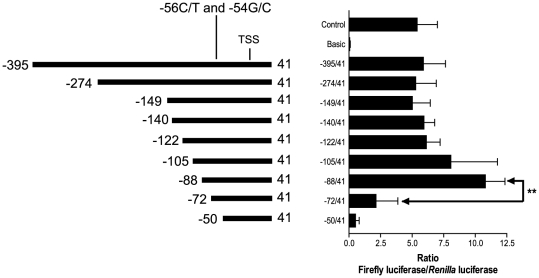
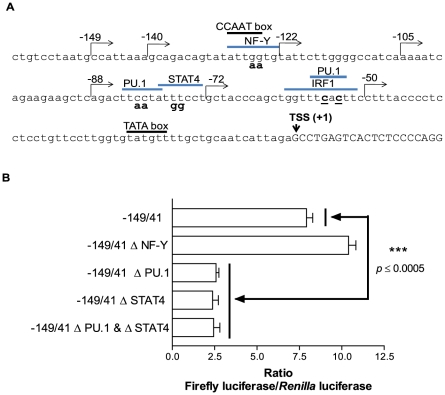
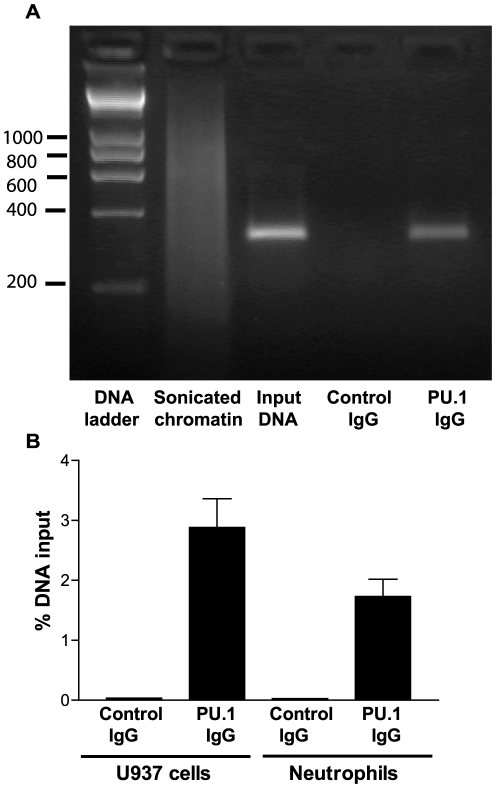
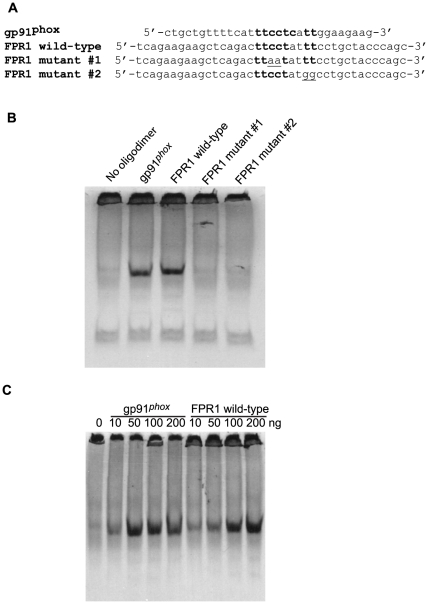
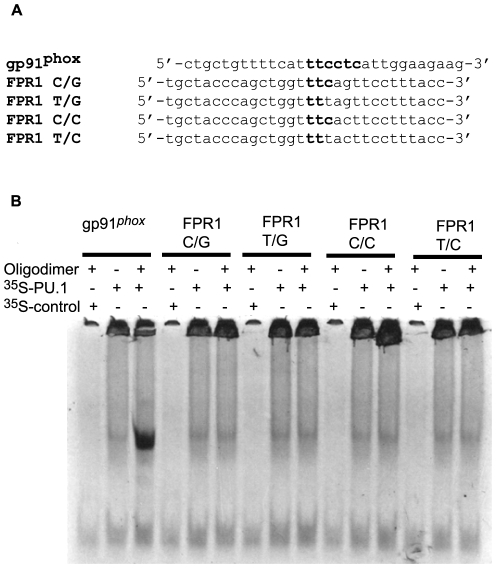
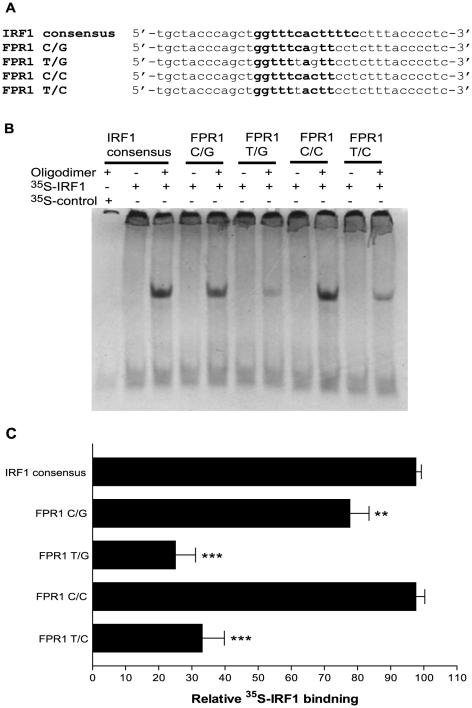
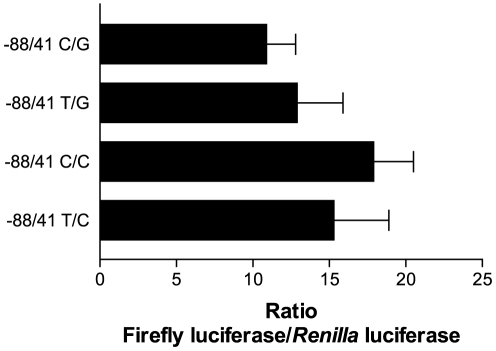
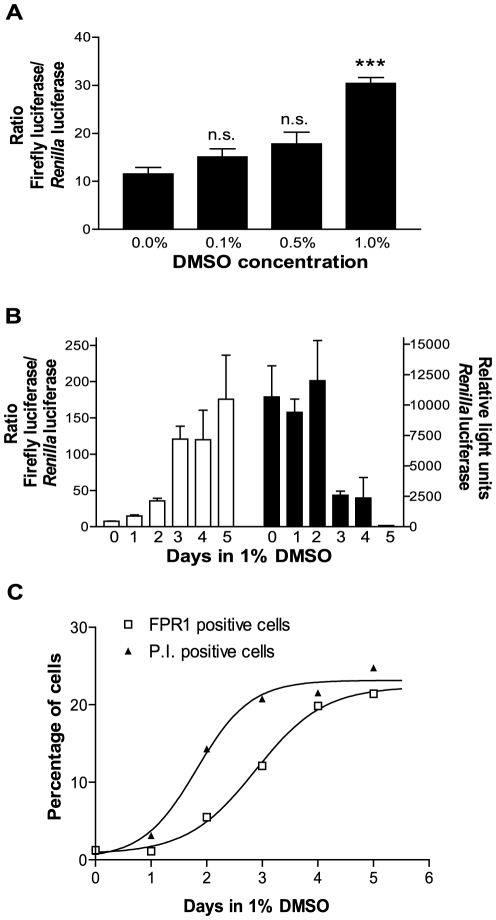
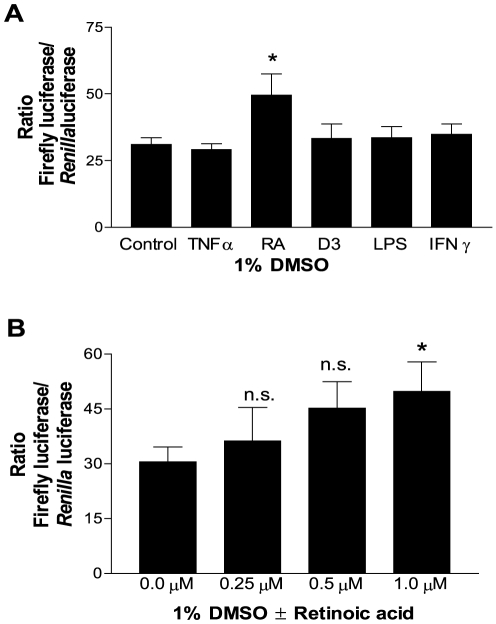
The gene encoding the human formyl peptide receptor 1 (FPR1) is heterogeneous, containing numerous single nucleotide polymorphisms (SNPs). Here, we examine the effect of these SNPs on gene transcription and protein translation. We also identify gene promoter sequences and putative FPR1 transcription factors. To test the effect of codon bias and codon pair bias on FPR1 expression, four FPR1 genetic variants were expressed in human myeloid U937 cells fused to a reporter gene encoding firefly luciferase. No significant differences in luciferase activity were detected, suggesting that the translational regulation and protein stability of FPR1 are modulated by factors other than the SNP codon bias and the variant amino acid properties. Deletion and mutagenesis analysis of the FPR1 promoter showed that a CCAAT box is not required for gene transcription. A -88/41 promoter construct resulted in the strongest transcriptional activity, whereas a -72/41 construct showed large reduction in activity. The region between -88 and -72 contains a consensus binding site for the transcription factor PU.1. Mutagenesis of this site caused significant reduction in reporter gene expression. The PU.1 binding was confirmed in vivo by chromatin immunoprecipitation, and the binding to nucleotides -84 to -76 (TTCCTATTT) was confirmed in vitro by an electrophoretic mobility shift assay. Thus, similar to many other myeloid genes, FPR1 promoter activity requires PU.1. Two single nucleotide polymorphisms at -56 and -54 did not significantly affect FPR1 gene expression, despite differences in binding of transcription factor IRF1 in vitro. Inflammatory mediators such as interferon-γ, tumor necrosis factor-α, and lipopolysaccharide did not increase FPR1 promoter activity in myeloid cells, whereas differentiation induced by DMSO and retinoic acid enhanced the activity. This implies that the expression of FPR1 in myeloid cells is developmentally regulated, and that the differentiated cells are equipped for immediate response to microbial infections.


Conflict of interest statement

Competing Interests: The authors have declared that no competing interests exist.

Figures

Figure 1
Figure 1. Four FPR1 variants show similar expression levels.
FPR1 haplotypes 8A, 11A, 12D and 16A were expressed as fusion proteins with firefly luciferase in U937 cells. Cells were electroporated with various amounts of the firefly luciferase reporter plasmid (as shown) and 300 ng pRL-TK Renilla luciferase control reporter plasmid. 24 h post-transfection cell extracts were analyzed using the Promega dual luciferase assay kit. The graphs show the mean ratios of firefly and Renilla luciferase from five separate experiments ± S.E.M. One-way analysis of variance showed no statistical differences between the haplotypes.
Figure 2
Figure 2. Identification of the minimal promoter region of FPR1.
Serial deletion fragments of the FPR1 promoter were generated by PCR and cloned upstream from the luciferase reporter gene in the pGL3 Basic vector. 10 µg of pGL3-Control vector containing the SV40 promoter was used as positive control and 30 µg of pGL3-Basic lacking a promoter was used to measure background luminescence. The amount of pGL3-Basic-FPR1 promoter plasmids in all experiments was 30 µg. U937 cells were co-electroporated with the firefly luciferase plasmids and 300 ng of pRL-TK as a transfection standard. Results show the mean ratios of firefly to Renilla luciferase 24 hours post-transfection from 6–19 separate experiments ± S.E.M. Unpaired t test demonstrated that the luciferase activity of the −72/41 construct was significantly lower than the activity of the −88/41 construct, **p-value<0.01. Abbreviation: TSS, transcriptional start site.
Figure 3
Figure 3. Location of putative transcription factor binding sites on FPR1 promoter.
A. Sequence analysis using PROMO3 software identified certain transcription factors commonly expressed in myeloid cells as putative regulators of FPR1 transcription. The numbers indicate the first nucleotide of the various promoter constructs in relation to the transcriptional start site (TSS). The −56 and −54 SNPs are underlined and the various mutations of putative transcription factor binding sites are in bold. B. Site-directed mutagenesis of the putative PU.1 and STAT4 binding sites resulted in a significant decrease in firefly luciferase activity. U937 cells were co-transfected with the indicated wild-type and promoter mutant constructs and pRL-TK to normalize for transfection efficiency. Data show the mean ratios from three experiments ± S.E.M. One-way analysis of variance showed that differences in luciferase activity among the constructs were significant (p value<0.0001), and unpaired t test showed that the luciferase activities of each of the PU.1 and STAT4 mutant constructs were significantly lower than that of the wild-type construct, p value≤0.0005.
Figure 4
Figure 4. Confirmation of PU.1 binding to FPR1 promoter by ChIP-qPCR.
A. Cross-linked chromatin from U937 cells was sonicated to obtain an average DNA length of 600–800 bp. Immunoprecipitation was carried out using irrelevant control IgG or IgG against PU.1. The bands correspond to PCR products obtained amplifying a 324 bp fragment containing the putative PU.1 site (−87 to 237). The input DNA was obtained prior to the immunoprecipitation and represents ∼4% of the chromatin used in the immunoprecipitation. B. Cross-linked immunoprecipitated chromatin from U937 cells and human neutrophils was quantified by real-time qPCR and the amount of product was determined relative to the input chromatin. Each bar represents the mean ratio from three experiments ± S.E.M.
Figure 5
Figure 5. Confirmation of PU.1 binding to FPR1 promoter by EMSA.
A. The following oligonucleotide dimers were used in the binding assays: gp91pho x with a known PU.1 binding site (positive control); FPR1 with a putative PU.1 binding site; two FPR1 oligodimers with nucleotide substitutions (underlined) in the putative binding site. B. In vitro synthesized 35S-PU.1 was incubated with or without gp91phox and FPR1 wild-type and mutant oligonucleotide dimers, as shown. C. Dose-dependence of 35S-PU.1binding was shown using 10–200 ng of gp91pho x and FPR1 oligodimers.
Figure 6
Figure 6. PU.1 does not bind the putative binding site in the −56/−54 SNP region of the promoter.
A. Oligonucleotide dimers of gp91phox with a known PU.1 binding site and FPR1 with the four possible −56/−54 SNP combinations were used in EMSA. B. In vitro synthesized 35S-PU.1 was incubated with gp91phox and the various FPR1 oligonucleotide dimers. Where indicated, the incubation was carried out with a negative control (in vitro transcription/translation product using vector alone) or in the absence of oligodimer.
Figure 7
Figure 7. IRF1 binds the putative binding site in the −56/−54 SNP region of the promoter.
A. Oligonucleotide dimers of IRF1 consensus binding sequence and FPR1 with the four possible −56/−54 SNP combinations were used in EMSA. B. In vitro synthesized 35S-IRF1 was incubated with IRF1 consensus dimer and the various FPR1 oligonucleotide dimers. Where indicated, the incubation was carried out with a negative control (in vitro transcription/translation product using vector alone) or in the absence of oligodimer. C. The binding of 35S-IRF1 to the various oligodimers was quantified by densitometry of the autoradiographic films. The results show the means ± S.E.M. from three experiments. One-way analysis of variance showed that the differences in luciferase activity among the FPR1 constructs were significant (P<0.0001), and unpaired t test showed a significant difference between C/G and each of the other FPR1 SNP constructs. **p-value<0.05, ***p-value<0.001.
Figure 8
Figure 8. No significant differences in transcriptional activity between the four promoter variants were detected.
FPR1 minimal promoters −88/41 −56C/−54G, −56T/−54G, −56C/−54C and −56T/−54C were cloned upstream from the luciferase reporter gene, electroporated into U937 cells and expression was analyzed in a dual luciferase assay, as previously described. The graphs show the mean ratios from seven experiments ± S.E.M. The differences are statistically not significant in one-way analysis of variance, p value = 0.391.
Figure 9
Figure 9. DMSO increases FPR1 promoter-mediated transcription.
A. Cells were co-transfected with pGL3 Basic-FPR1 −149/41 and pRL-TK and incubated for 48 h in the presence or absence of DMSO prior to dual luciferase assay. The graphs show the mean ratios from four experiments ± S.E.M. Unpaired t test, *** p-value<0.0001. B. Cells were incubated for a total of 0–4 days in the presence of 1% DMSO prior to co-transfection with pGL3 Basic-FPR1 −149/41 and pRL-TK. Cells were then incubated for another 24 h in the presence or absence of DMSO before dual luciferase assay. The white bars show the firefly luciferase/Renilla luciferase ratio, and the black bars show the Renilla luciferase activity in relative light units. The results show the mean ratios of triplicate samples ± S.E.M. C. U937 cells were incubated for 0–5 days in the presence of 1% DMSO prior to analysis by flow cytometry. Cells were incubated on ice for 1 h with 20 nM N-formyl-Nle-Leu-Phe-Nle-Tyr-Lys-fluorescein and 1 µg/ml propidium iodide, followed by analysis of 10,000 cells. The graph shows the percentage of cells that bound fluorescent ligand (FPR1 positive cells) and the percentage of dead cells (propidium iodide positive cells). The scatter plots can be seen in Figure S1 (Supporting Information).
Figure 10
Figure 10. Retinoic acid in the presence of DMSO further increases FPR1 promoter-mediated transcription.
A. Cells were co-transfected with pGL3 Basic-FPR1 −149/41 and pRL-TK and incubated for 48 h in the presence of 1% DMSO ± 100 U/ml tumor necrosis factor α (TNFα), 1 µM all-trans retinoic acid (RA), 10 nM 1,25 (OH)2-vitamin D3 (D3), 100 ng/ml lipopolysaccharide (LPS) and 500 U/ml interferon γ (IFNγ). The results are from three experiments ± S.E.M. Unpaired t test, * p-value<0.05. B. Cells were co-transfected with the pGL3 Basic-FPR1 −149/41 plasmid and pRL-TK and incubated for 48 h in the presence of 1% DMSO ± various concentrations of all-trans retinoic acid (as shown). The graphs show the mean ratios from four experiments ± S.E.M. Unpaired t test, * p-value<0.05.

References

    1. Ye RD, Boulay F. Structure and function of leukocyte chemoattractant receptors. Adv Phamacol. 1997;39:221–289. - PubMed
    1. Sahagun-Ruiz A, Colla JS, Juhn J, Gao J-L, Murphy PM, et al. Contrasting evolution of the human leukocyte N-formylpeptide receptor subtypes FPR and FPRL1. Genes Immun. 2001;2:335–342. - PubMed
    1. Zhang Y, Syed R, Uygar C, Pallos D, Gorry MC, et al. Evaluation of human leukocyte N-formyl peptide receptor (FPR1) SNPs in aggressive periodontitis patients. Genes Immun. 2003;4:22–29. - PubMed
    1. Gripentrog JM, Mills JS, Saari GJ, Miettinen HM. Variable responses of formyl peptide receptor haplotypes toward bacterial peptides. Immunogenetics. 2008;60:83–93. - PMC - PubMed
    1. Gutman GA, Hatfield GW. Nonrandom utilization of codon pairs in Escherichia coli. Proc Natl Acad Sci U S A. 1989;86:3699–3703. - PMC - PubMed

Publication types

MeSH terms